OntiCards User Manual
Enterprise-grade AI Data Hub · making databases "understand human language"
This manual explains how to use every functional module of OntiCards in detail, covering the full workflow from login and initialization, data source onboarding, AI-powered querying, and data quality checks to system administration. It helps business operators, data analysts, data governance specialists, and managers get up to speed quickly and get the most out of this AI data hub.
1. Product Overview
1.1 Positioning
OntiCards is an enterprise-grade AI Data Hub that provides one-stop capabilities around your business databases:
📌 It turns enterprise databases from "usable only by people who can write SQL" into something that anyone who speaks the business language can query, govern, manage, and audit.
Unlike traditional BI tools, OntiCards is built around AI-driven natural-language interaction, so business teams can truly self-serve their data. And unlike typical NL2SQL toys, OntiCards chains data ingestion → metadata understanding → AI querying → data quality checks → platform management into one complete closed loop.
1.2 Core Capabilities
| Capability | Description |
|---|---|
| 📡 Multi-source data ingestion | Supports MySQL, PostgreSQL, Oracle, DMDB, KingBase, OceanBase, SQL Server, Trino, SQLite, etc. |
| 🧠 Intelligent data understanding | Automatically generates data cards, field profiles, business glossaries, and AI-powered table relationship discovery |
| 🔍 Natural-language query | NL2SQL engine with multi-step reasoning, multi-dialect support, automatic expansion of business terms, and safety checks |
| 🔗 Cross-source join queries | Queries multiple data sources at once with automatic result alignment, breaking down data silos |
| ✅ Data quality platform | Multiple rule types, quality scoring, and automated quality reports |
| 🏢 Enterprise platform capabilities | Data source isolation, sensitive-data masking, operation auditing, API-Key, JWT-SSO, query monitoring, and cost statistics |
| 🤖 Third-party integration | Connects to agents, RPA, BI platforms, and in-house systems via API-Key |
1.3 Target Users
| Role | Use case | Value gained |
|---|---|---|
| Business operators | Daily data monitoring, anomaly investigation | Self-serve queries without waiting on the data team |
| Data analysts | Hypothesis validation, ad-hoc queries, cross-database consolidation | Saves SQL writing time, focuses on analysis |
| Data governance specialists | Rule library configuration, quality check execution, terminology standardization | Systematically improves data quality |
| Management | Multi-source aggregation and comparison, decision support | Global visibility for faster decisions |
| IT / data teams | Data source management, permission control, audit monitoring | A unified control plane at lower operational cost |
| Business system developers | Integrating AI query capabilities via API | Injects AI querying into business systems |
1.4 Main Navigation
After login, the left main navigation contains the following modules:
| Navigation | Path | Purpose |
|---|---|---|
| Overview | /overview | Data source overview, usage flow, quick entries |
| Workspace | /workspaces | Manage all data sources, enter data source details |
| Business Terms | /business-terms | Shared business glossaries across data sources |
| Data Quality | /governance | Rule libraries, execution, reports |
| Monitoring | /monitoring | Real-time query volume, Token usage, performance monitoring |
| Cost Management | /cost-config | Token costs and daily cost trends |
| System & Account | /settings | Account, users, API-Key, models, confidentiality settings |
| Help | /help | Documentation, FAQ, feedback |
2. Login and Initial Setup
2.1 Login Methods
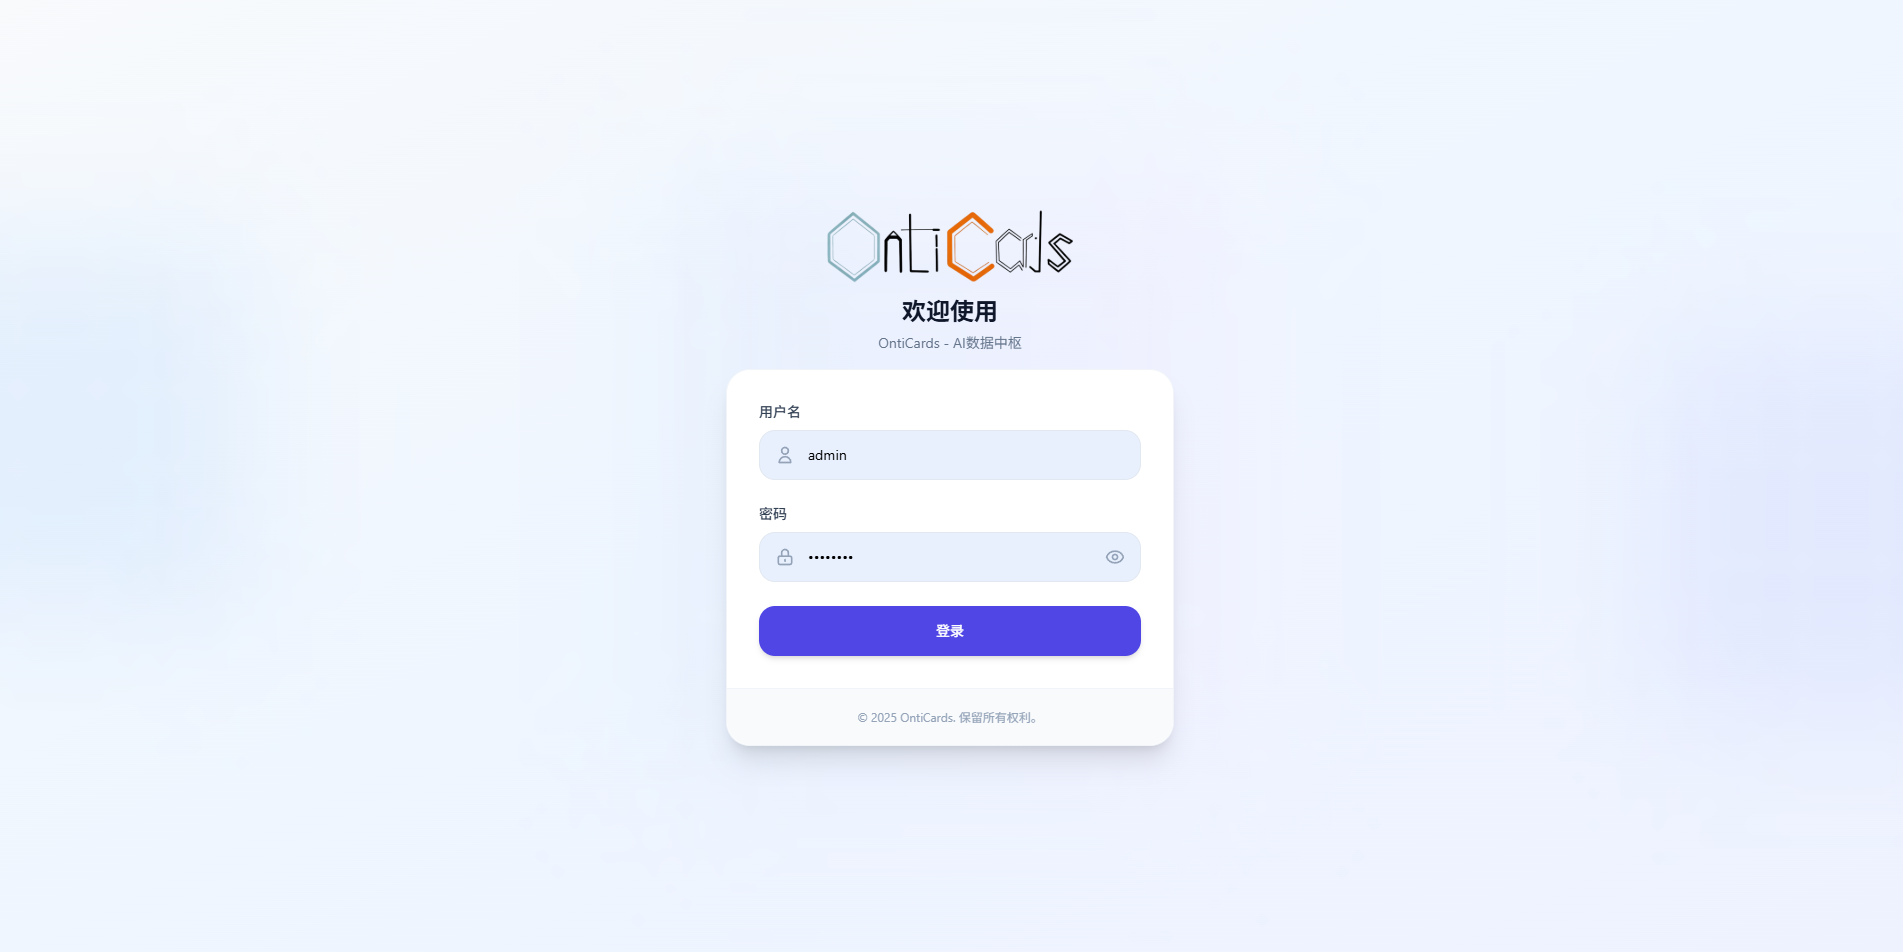
After opening OntiCards you will see the login page. The following login methods are available:
Method 1: Username and password login (default)
- Enter your account name in the username field
- Enter your password in the password field (click the eye icon to reveal the plaintext)
- Click the Login button
💡 If you forgot your password, contact the system administrator to reset it.
Method 2: JWT-SSO single sign-on (enterprise edition)
OntiCards can be connected to your corporate identity system (via JWT), allowing users to sign in with their corporate account in one click. See Deployment Guide - SSO Configuration for integration details.
2.2 Overview Page
After a successful login you land on the Overview page by default.
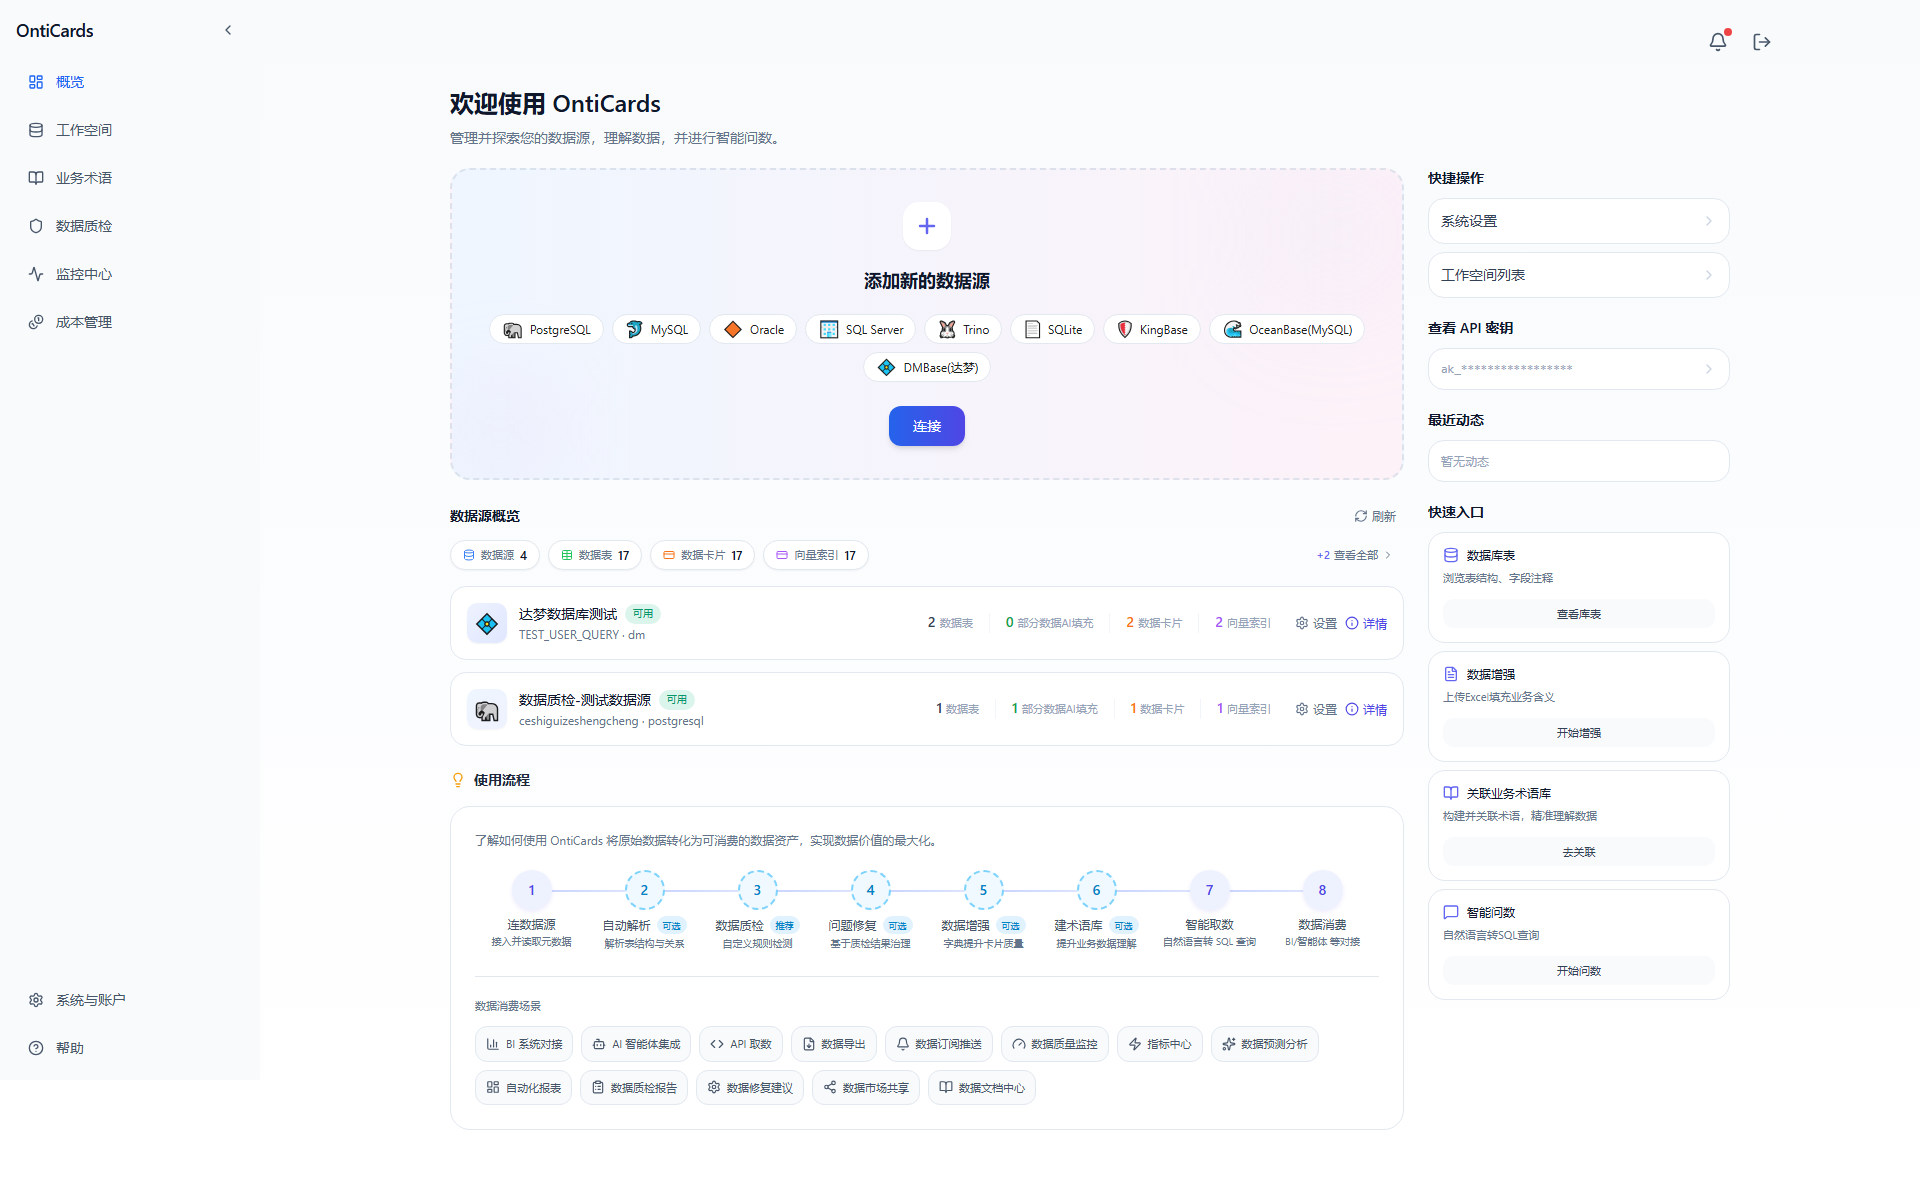
The home page contains the following areas:
- Quick add data source: connection cards for 8 mainstream databases (PostgreSQL, MySQL, Oracle, SQL Server, Trino, SQLite, KingBase, OceanBase(MySQL), DMBase(达梦)). Click the Connect button to jump straight into the new data source flow
- Data source overview: the top area shows key metrics for the current account, such as the total number of data sources, tables, data cards, and vector indexes
- Data source list: shows all added data sources as cards, with connection status, table count, data card count, and last update time
- Usage flow: an 8-step diagram showing the complete path (connect data source → automatic parsing → data enrichment → issue fixing → data enrichment → build glossary → smart querying → data governance)
- Data circulation scenarios: typical scenarios such as B-system integration, API querying, data export, data subscription reads, data quality monitoring, metrics center, and data preview
- Quick actions (right side): system settings, workspace list, view API keys, recent activity
2.3 First-Time Usage Flow
The recommended flow for first-time use:
Log in to the system
   ↓
[Required] Add a data source
   ↓
[Automatic] The system generates data cards
   ↓
[Recommended] Field annotation enhancement (upload Excel dictionary)
   ↓
[Recommended] Create and enable the business glossary
   ↓
[Recommended] Start data inventory (full-scope or targeted)
   ↓
Start natural language querying
   ↓
[On demand] Configure data quality rules → start execution
   ↓
[On demand] Monitor query activity, review history and costs
⏱️ Completing the first 4 steps (login, add a data source, generate cards, add glossary terms) usually gets you querying within 30 minutes.
3. Workspace (Data Source Management)
The Workspace is the center for managing all data sources in OntiCards.
3.1 Workspace Overview
Entering the Workspace shows all the data sources you have added.
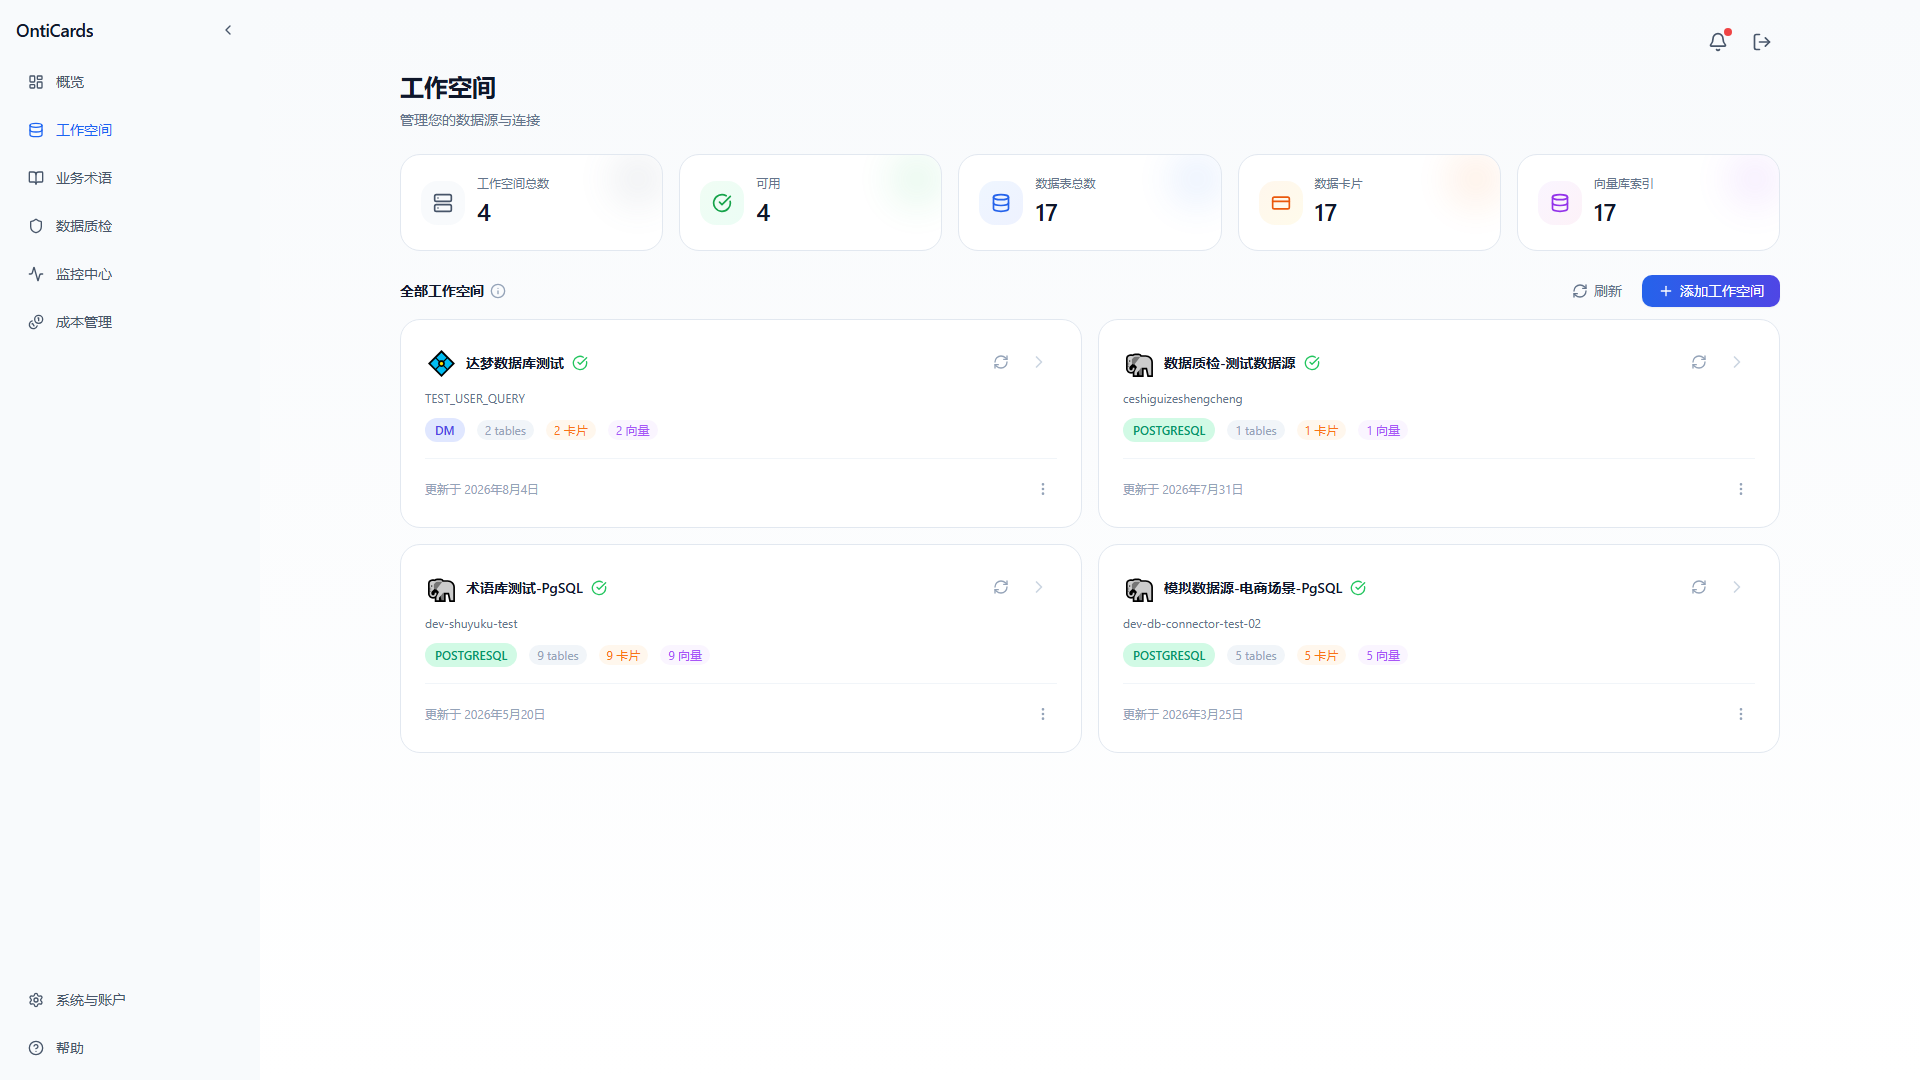
Top metric cards:
| Metric | Meaning |
|---|---|
| Total workspaces | Number of data sources added under the current account |
| Available | Number of data sources with the status "Available" |
| Total tables | Total number of tables/views across all data sources |
| Data cards | Number of AI data cards generated |
| Vector indexes | Number of vector indexes built (used for NL2SQL retrieval) |
Each data source card shows:
- Database type label (POSTGRESQL, DM, ORACLE, etc.)
- Name and English alias
- Database type icon
- Table count, card count, vector index count
- Status (Available / Error)
- Last update date
- Action buttons: refresh, settings, details
3.2 Adding a Data Source
Step 1: Open the add form
Click the Connect button (in the quick add area or the top right corner) on the Workspace or Overview page. The add data source dialog appears.
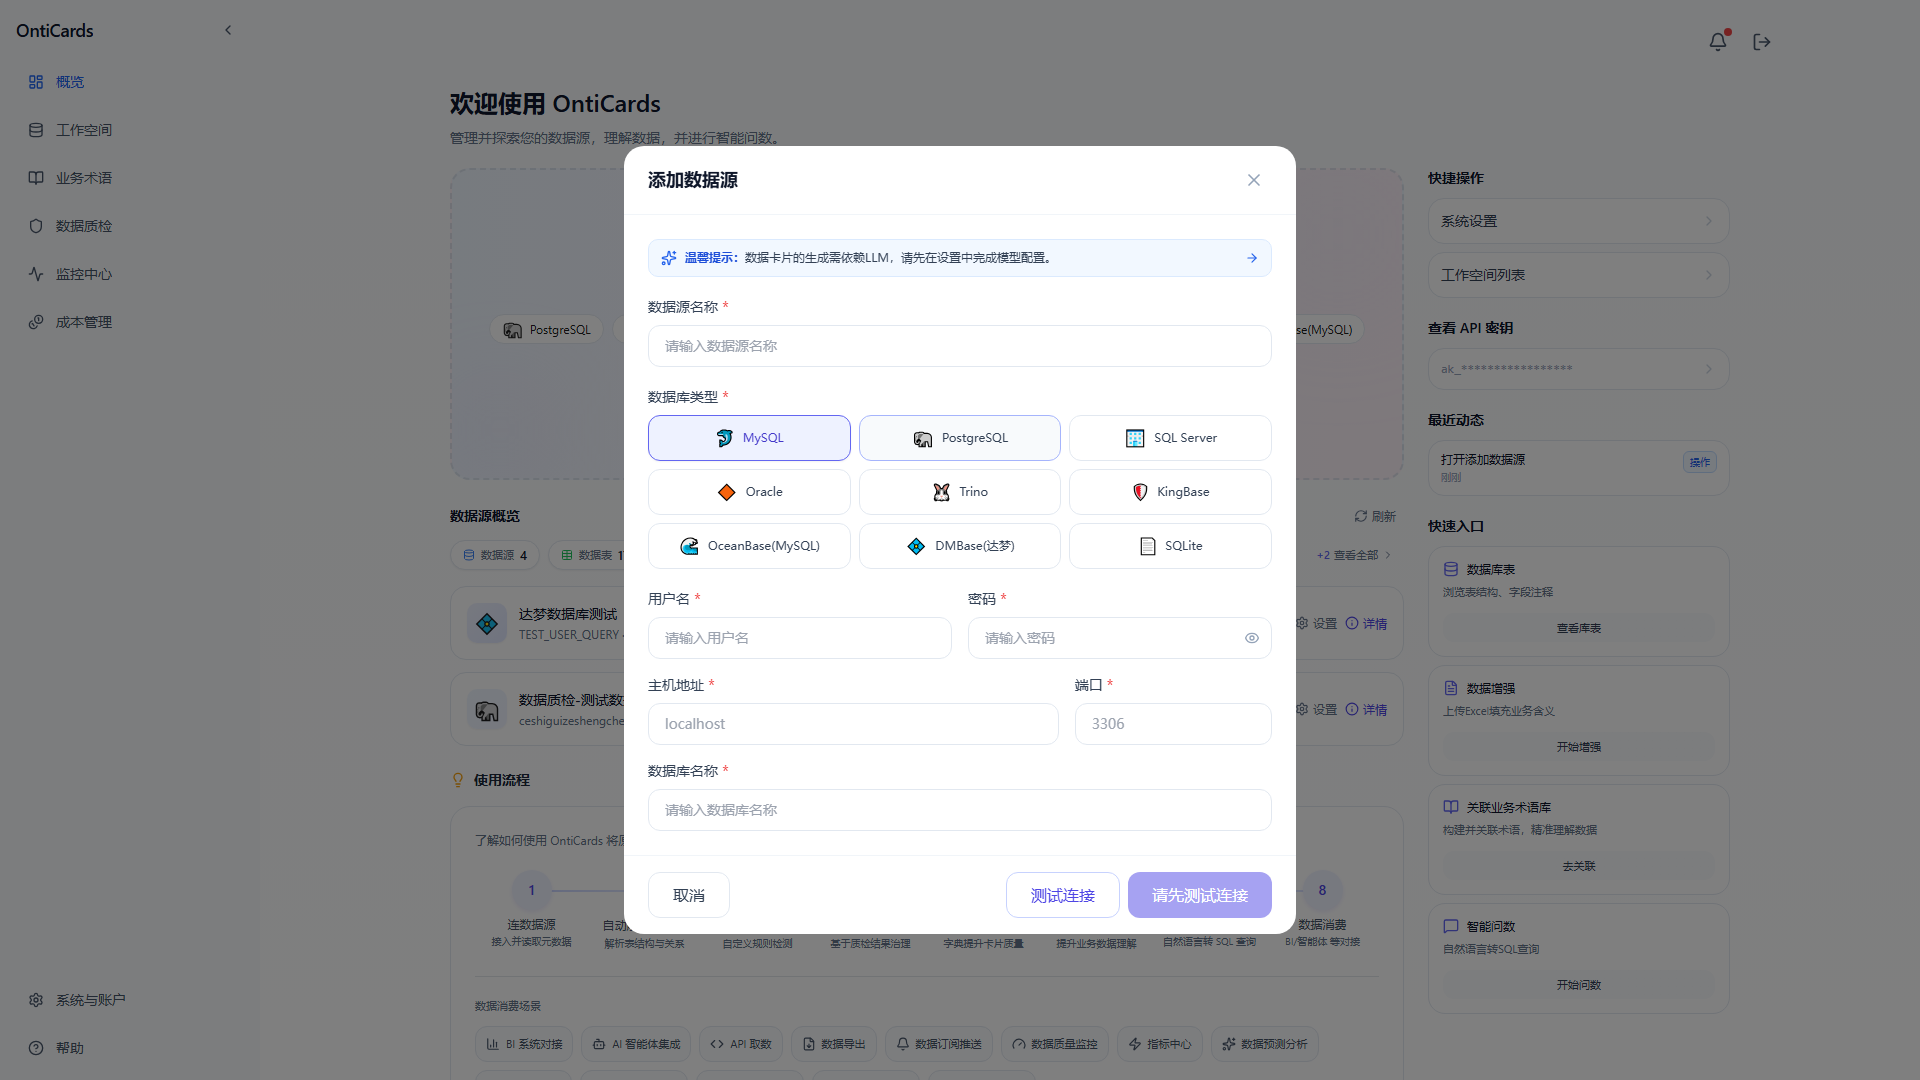
Step 2: Fill in the connection details
| Field | Description | Example |
|---|---|---|
| Data source name * | A business name for easy recognition | ecommerce_prod |
| Data source type * | One of 9 database types | MySQL |
| Username * | An account with SELECT permission | readonly_user |
| Password * | The password for the account | ****** |
| Host * | Database server IP or domain | 192.168.1.100 |
| Port * | Database listening port | 3306 |
| Database name * | The specific database to connect to | ecommerce |
Step 3: Test the connection
Click Test Connection; the system verifies:
- Network reachability
- Username/password correctness
- Whether the target database exists
- The required permissions (SELECT)
Once the test passes, the button changes to "Please test the connection first" and you can continue to save.
Step 4: Save
Click the button — it changes to Save — to submit. The system will:
- Write the data source metadata
- Automatically pull all table and field information
- Automatically start the data card generation task (asynchronous)
- Write it to the Tasks tab, where you can track progress
🔐 Important: for security, use a read-only account with SELECT permission only. OntiCards never executes any DML/DDL operations.
3.3 Supported Database Types
| Database | Type | Notes |
|---|---|---|
| MySQL | Open source | Mainstream database, 5.7+ |
| PostgreSQL | Open source | 10+, compatible with KingBase |
| Oracle | Commercial | 11g+ |
| SQL Server | Commercial | 2012+ |
| Trino | OLAP | Big-data query engine |
| SQLite | Lightweight | Testing / small scale |
| KingBase | Domestic | China Electronics KingBase |
| OceanBase (MySQL) | Domestic | Ant Group's distributed database (MySQL tenant) |
| DMBase(达梦) | Domestic | Wuhan DMDB, V8 |
3.4 Refreshing a Data Source
When the database schema changes (new tables, added/modified fields), a refresh is needed:
- Click the Refresh icon in the top right corner of the data source card
- The system incrementally detects changed tables and fields
- Data card generation is started automatically for new tables
- Existing cards keep any manual edits
💡 Smart incremental detection: only the tables that changed are regenerated, avoiding long refreshes on large databases.
3.5 Deleting a Data Source
- Click Delete in the "..." menu in the top right corner of the data source card
- A confirmation dialog appears
- After confirmation, the data source and all its data cards and query history are removed
⚠️ Deletion is irreversible. If you are worried about accidental deletion, mark the data source as disabled first (if you have that permission).
4. Data Source Details
Click anywhere on a data source card to enter its details page.
The details page contains the following top information and 8 functional tabs:
Top information:
- Data source name and connection status badge
- Table count, data card count, vector index count, last update time
- Settings button: opens data source configuration
- Run Discovery button: quickly starts a data discovery task
8 functional tabs:
| Tab | Purpose |
|---|---|
| Overview | Data source overview, connection info, table and card statistics |
| Tables | Browse all tables and fields, view details |
| Cards | Browse/manage AI data cards |
| Enrichment | Upload field comments via Excel |
| Query | Natural-language query entry |
| Knowledge | Business glossaries linked to this data source |
| History | Query history for this data source |
| Tasks | Data discovery tasks (targeted/full) |
4.1 Overview
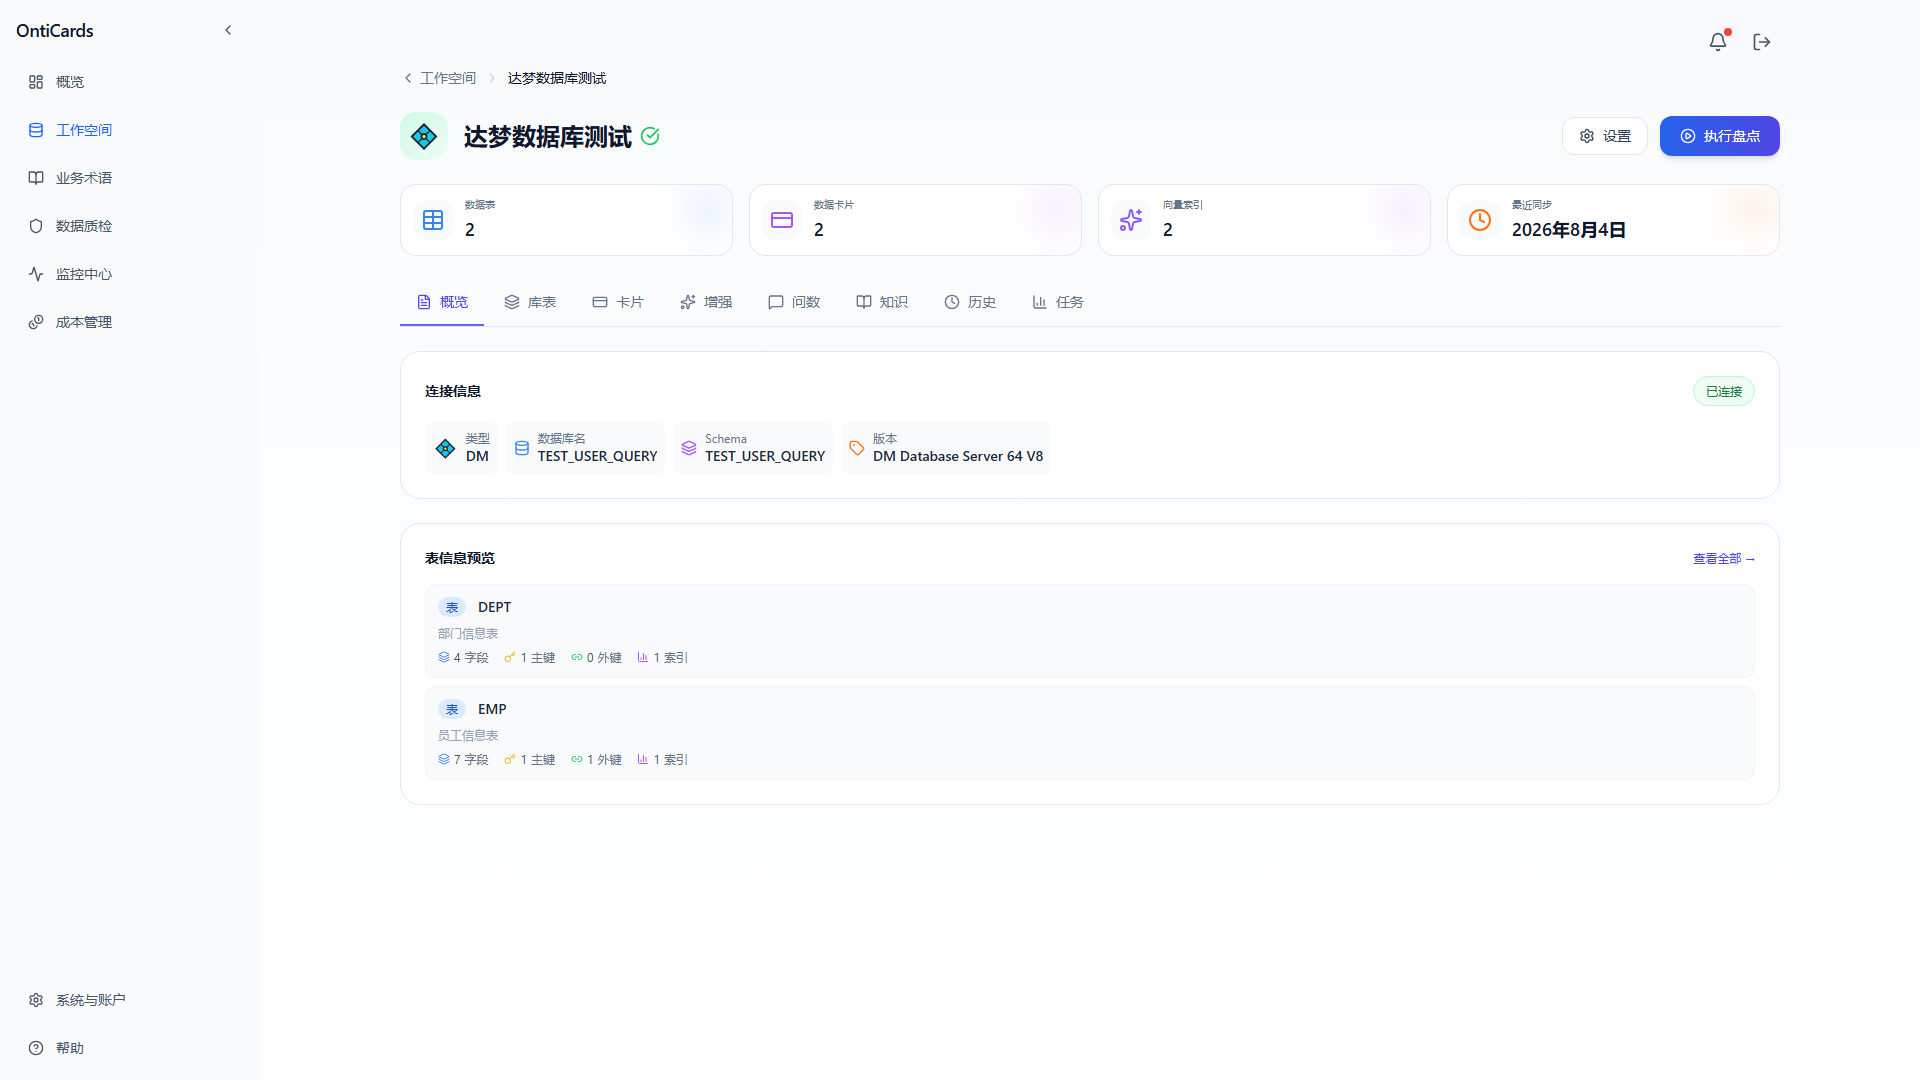
Shows:
- Connection info: type, database name, schema, version
- Table and card completion: lists all tables, each showing whether its card is "generated/not generated"
- Field distribution within tables: primary keys, foreign keys, index counts
4.2 Tables
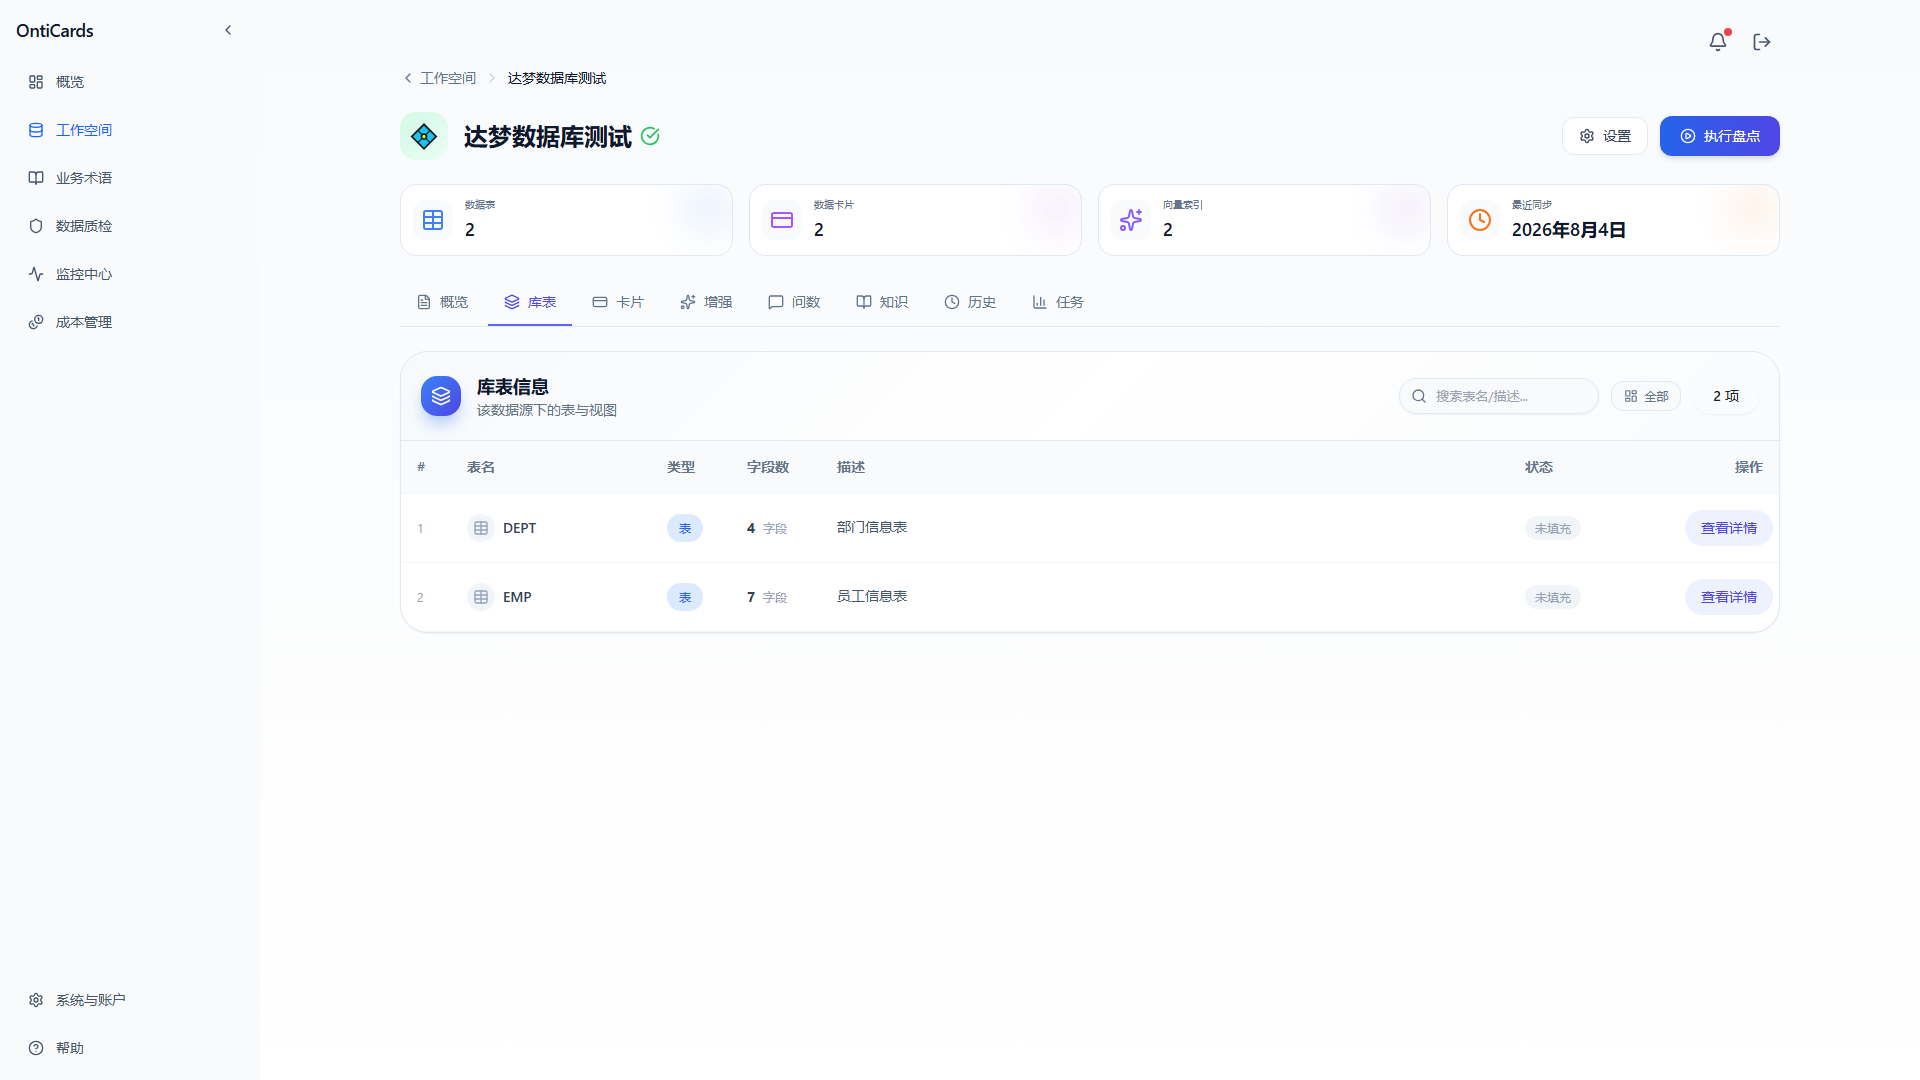
This tab lists all tables and views under the data source:
- Table name: shown with the original database name by default
- Type: TABLE / VIEW
- Field count: number of fields in each table
- Description: the auto-generated business description of the table
- Status: whether a card has been generated (filled / not filled)
- Actions: view details, generate/regenerate the data card
Click a table name or "View details":
You can enter the table details page to browse:
- The complete field list of the table (field name, type, primary key or not, nullable or not, default value, comment)
- The correspondence between fields and the data card
- Common usage of fields in example queries
4.3 Cards (Data Cards)
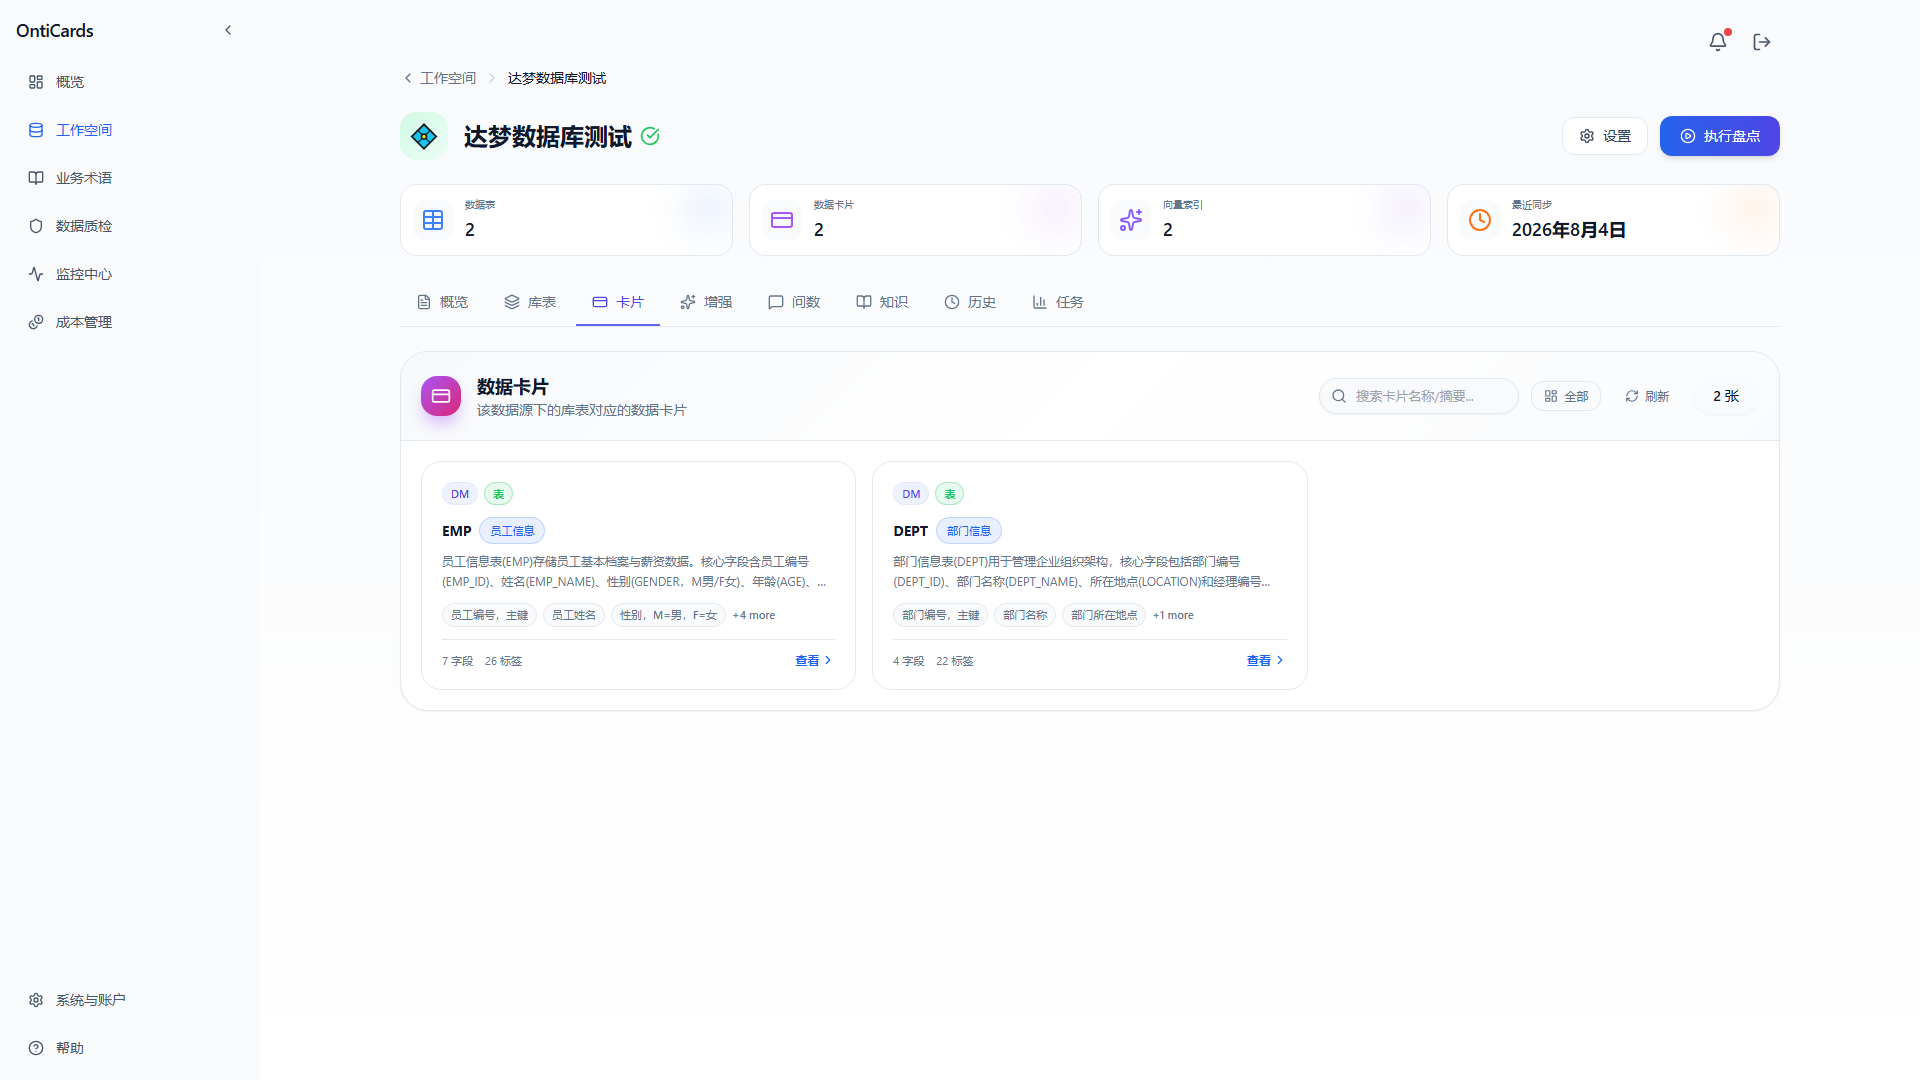
Data cards are among OntiCards' most important metadata assets. The system automatically generates a "business manual" for every table.
The card list shows the data cards for all tables under this data source; each card displays:
- Database type badge
- Table name (e.g.
EMP,DEPT)
- Business description (automatic summary)
- Key field tags
- Field and comment counts (e.g.
7 fields / 21 tags)
Click "View" to enter the card details:
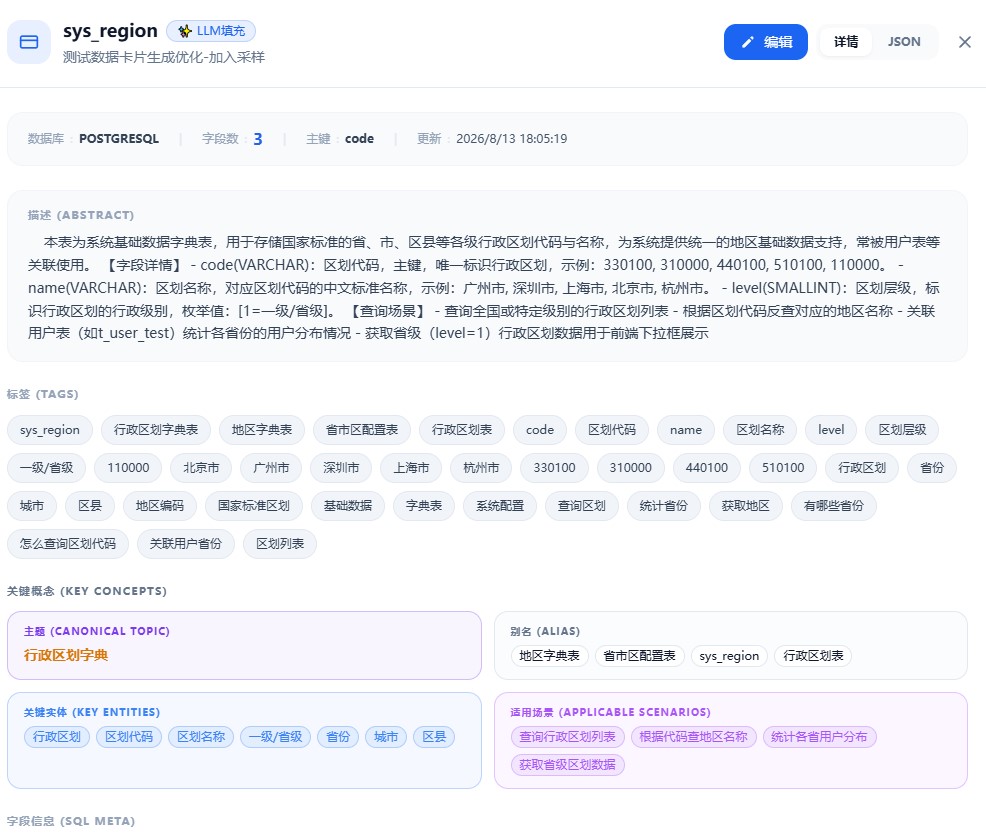
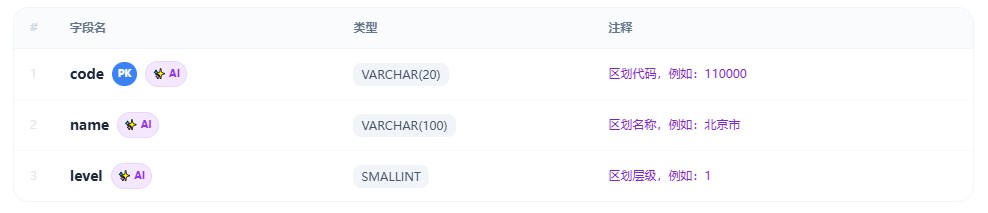
A complete data card contains 6 core modules. Using sys_region (the administrative division dictionary table) as an example:
| Module | Content | Example |
|---|---|---|
| ABSTRACT(描述) | Business purpose of the table + per-field explanation + query scenarios | System base dictionary table storing national standard province/city/district codes and names; field code is the primary key with a unique administrative code, name is the division name, level is the division level |
| TAGS(标签) | Auto-generated field tags and business terms | sys_region, 行政区划字典表, 主键, code, enum values such as 北京市 广州市 上海市 |
| KEY CONCEPTS(关键概念) | Theme and aliases of the table | Theme: administrative division dictionary; aliases: region dictionary table, province/city/district config table, administrative list |
| KEY ENTITIES(关键实体) | Business entity types involved in the table | Administrative divisions, division codes, division names, first-level/provincial, provinces, cities, districts |
| APPLICABLE SCENARIOS(适用场景) | Business questions this table can answer | Query the administrative division list, look up region names by code, count user distribution by province, get provincial division data |
| SQL META(元数据) | Complete list of field names, types, and comments | At the bottom of the other details |
About the "LLM-generated" badge:
- The 🪄 LLM-generated marker next to the card title indicates the card was auto-generated by the LLM
- Manually edited cards automatically lose this badge and will not be overwritten on data source refresh
- The JSON tab exposes the card's structured data for integration with external systems
Manual editing:
Click the Edit button to manually correct:
- Table description
- Field comments (modify/add)
- Tags (add/remove)
- Key concepts (add/remove)
- Applicable scenarios (add/remove)
💡 Tip: manually edited cards are locked and will not be overwritten when the data source is refreshed. The system also supports regeneration.
4.4 Enrichment
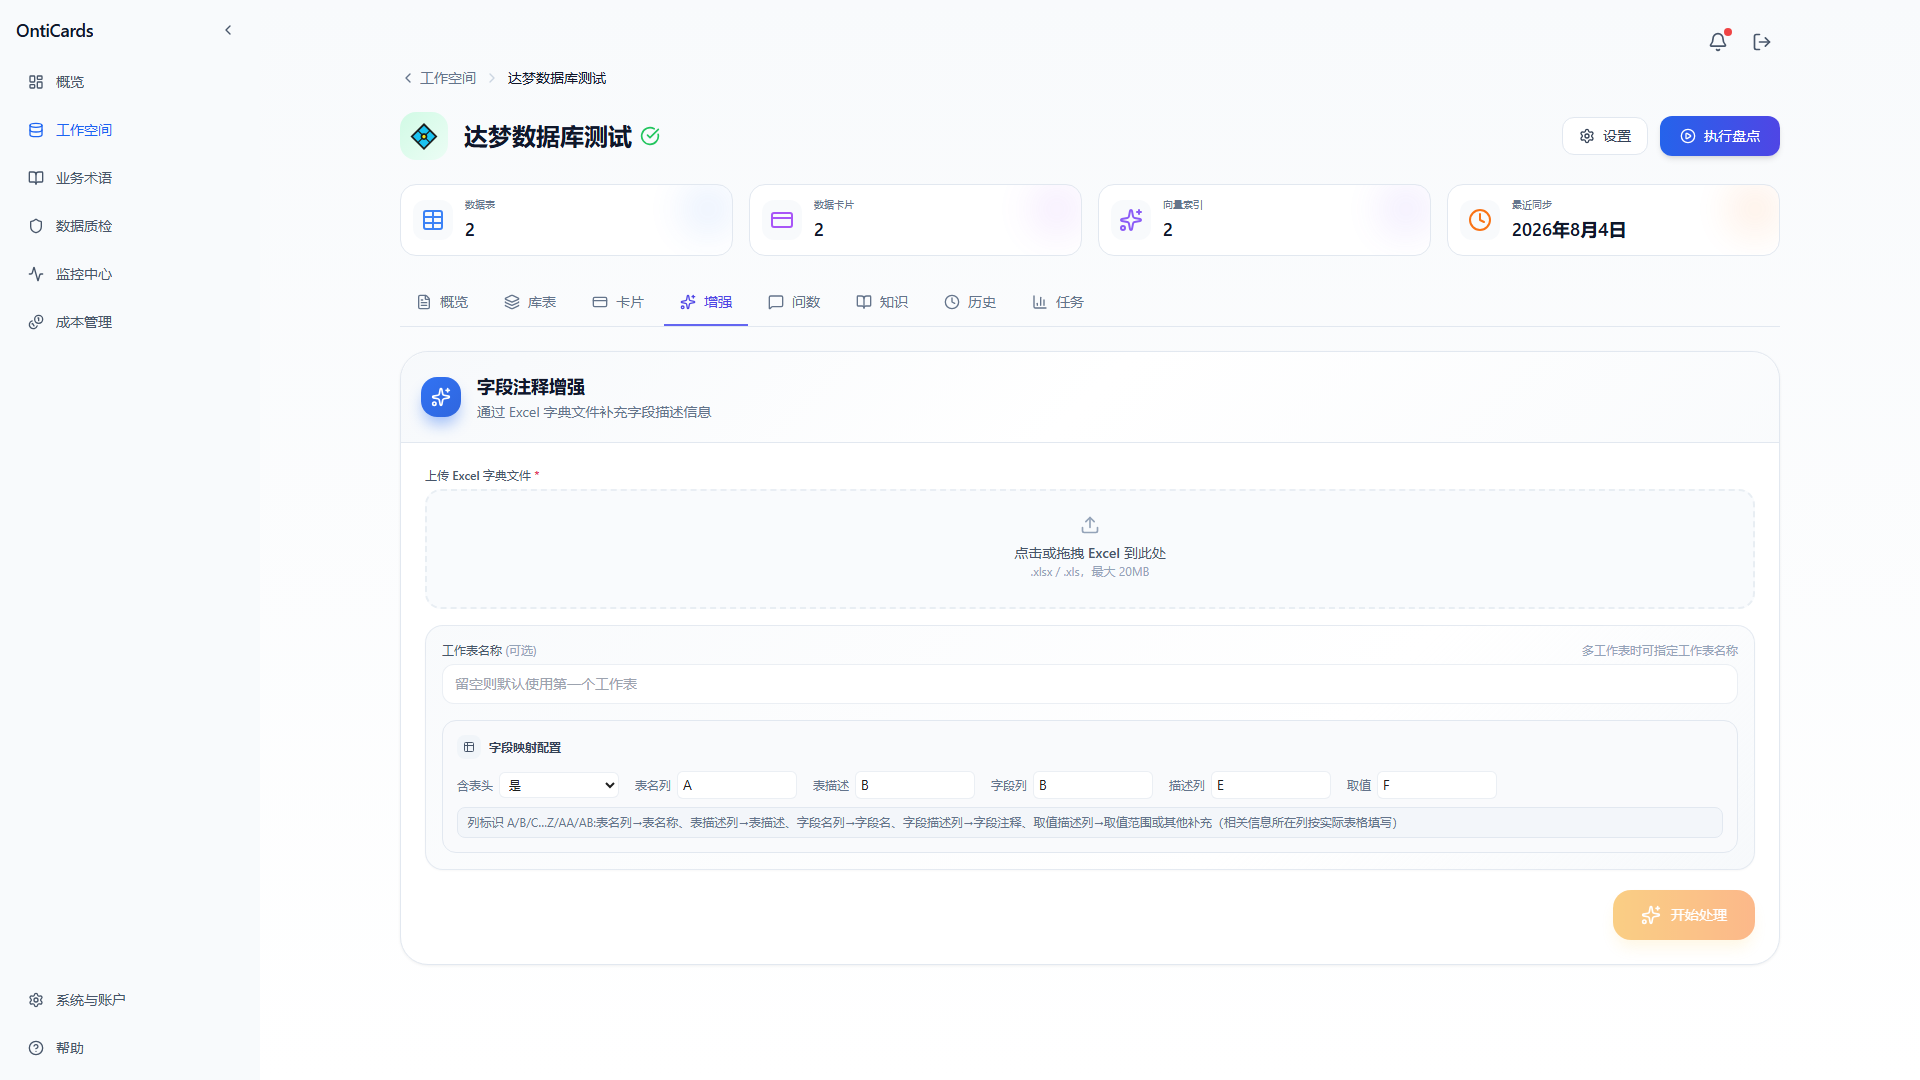
The Enrichment tab is used to batch-add field comments from an Excel dictionary, suitable when:
- The auto-generated comments are not accurate enough
- Your company already has a business data dictionary in Excel
- Business experts need to complete a large number of fields in bulk
Usage flow:
- Prepare an Excel file (.xlsx / .xls), up to 20MB
- The first worksheet is used as the default dictionary sheet
- Configure the column mapping: select which columns are table name, field name, and field comment
- Click Start Processing
- When finished, the comments are written into the corresponding data cards
💡 The Excel column mapping is flexible (choose which columns hold table name / field name / field comment), and a single worksheet can contain multiple table names (in different rows).
4.5 Query
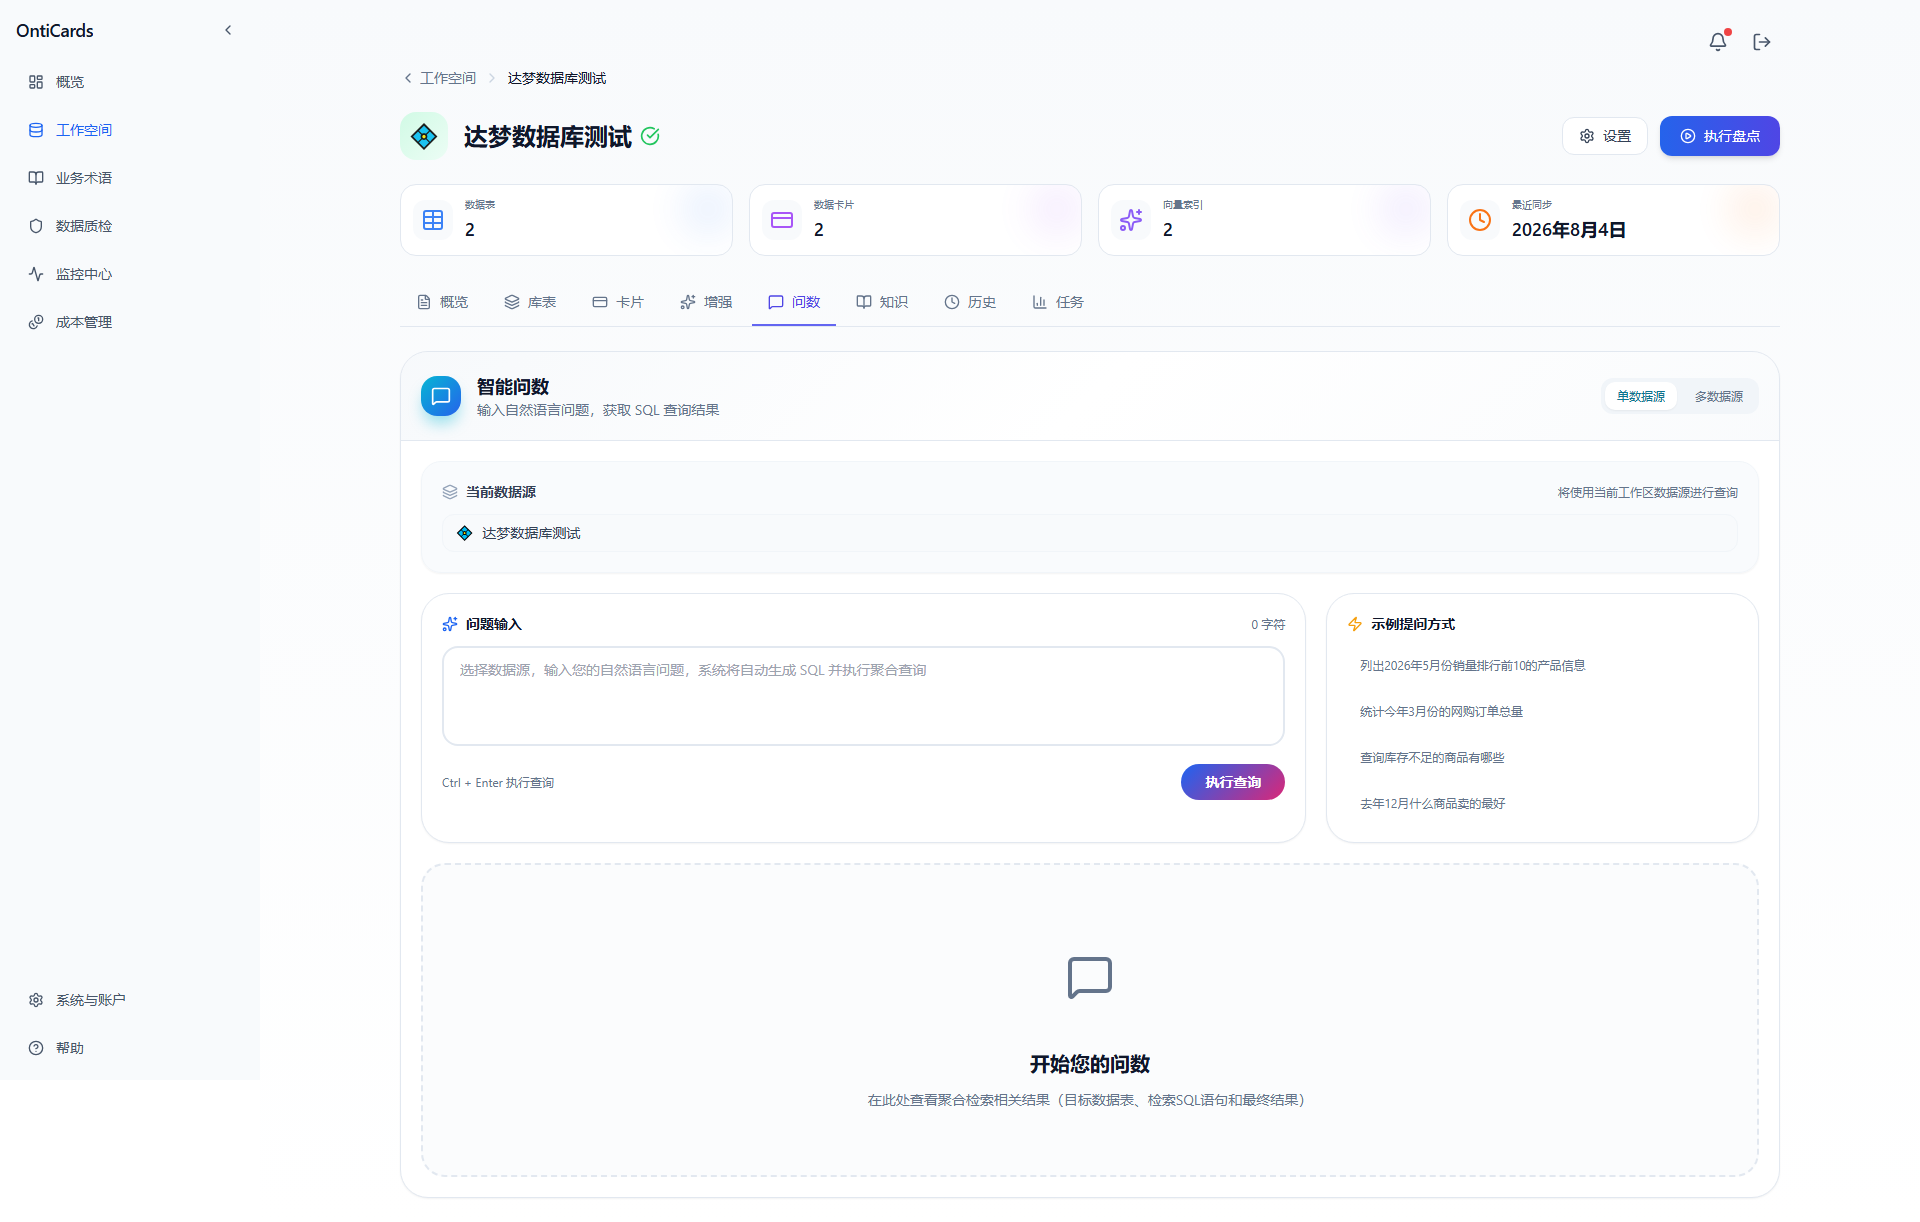
Query is the core interaction entry of OntiCards. In this tab:
Main area on the left:
- Question input box: supports multi-line input; press
Ctrl + Enterfor a new line
- Run Query button: submits the natural-language question
- Mode switch: "Single data source" / "Multiple data sources"
Current data source card: makes it explicit which data source this query applies to
Example questions area (right side "Example questions"): click to fill in an example question and try it immediately.
Multiple data source mode:
After switching to "Multiple data sources", you can check several data sources at once. The system will:
- Understand the question
- Automatically plan which data sources to query
- Align fields after cross-database queries
- Merge and present the results
A real query example:
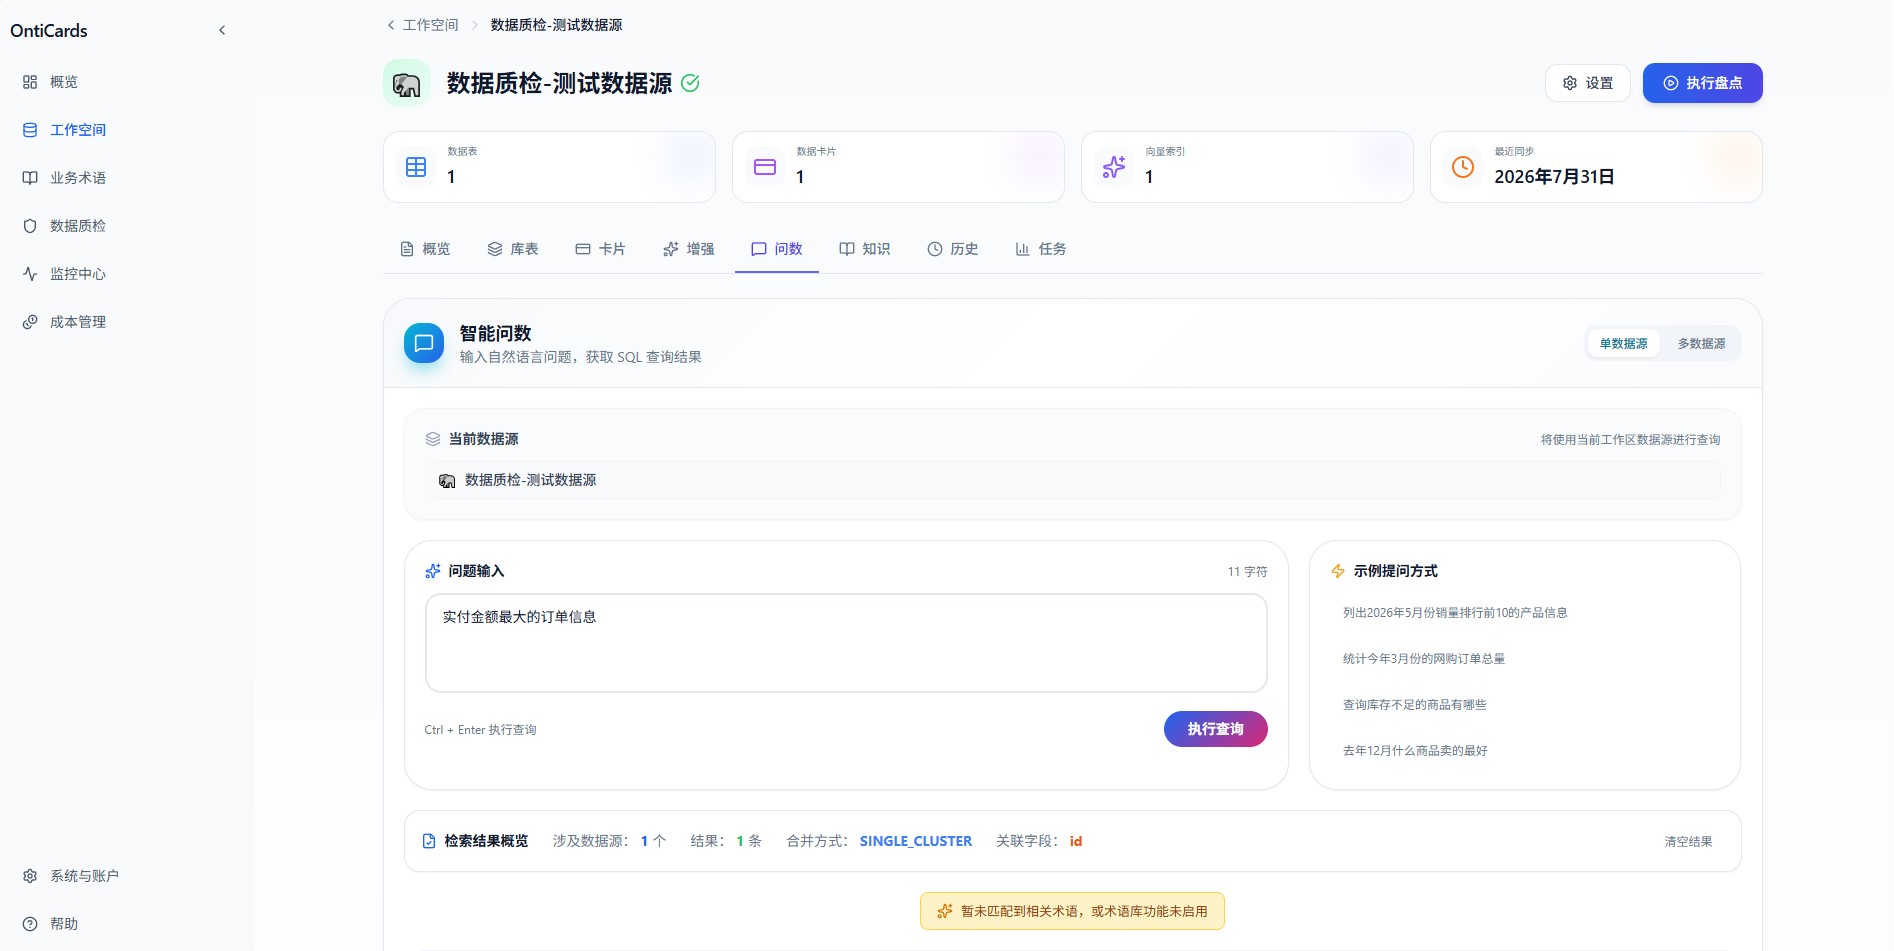
As shown above, asking "order information with the largest paid amount" under the "Data quality check - test data source":
- Top statistics: 4 overview metrics — tables / cards / queries / recent queries
- Source selection: makes it explicit to the system which data source this query applies to
- Question input area: shortcut hint
Ctrl + Enterat the bottom right
- Example questions on the right: click one to fill it in quickly
- Retrieval result overview: at the bottom, showing the number of data sources involved, result count, merge method, and key fields
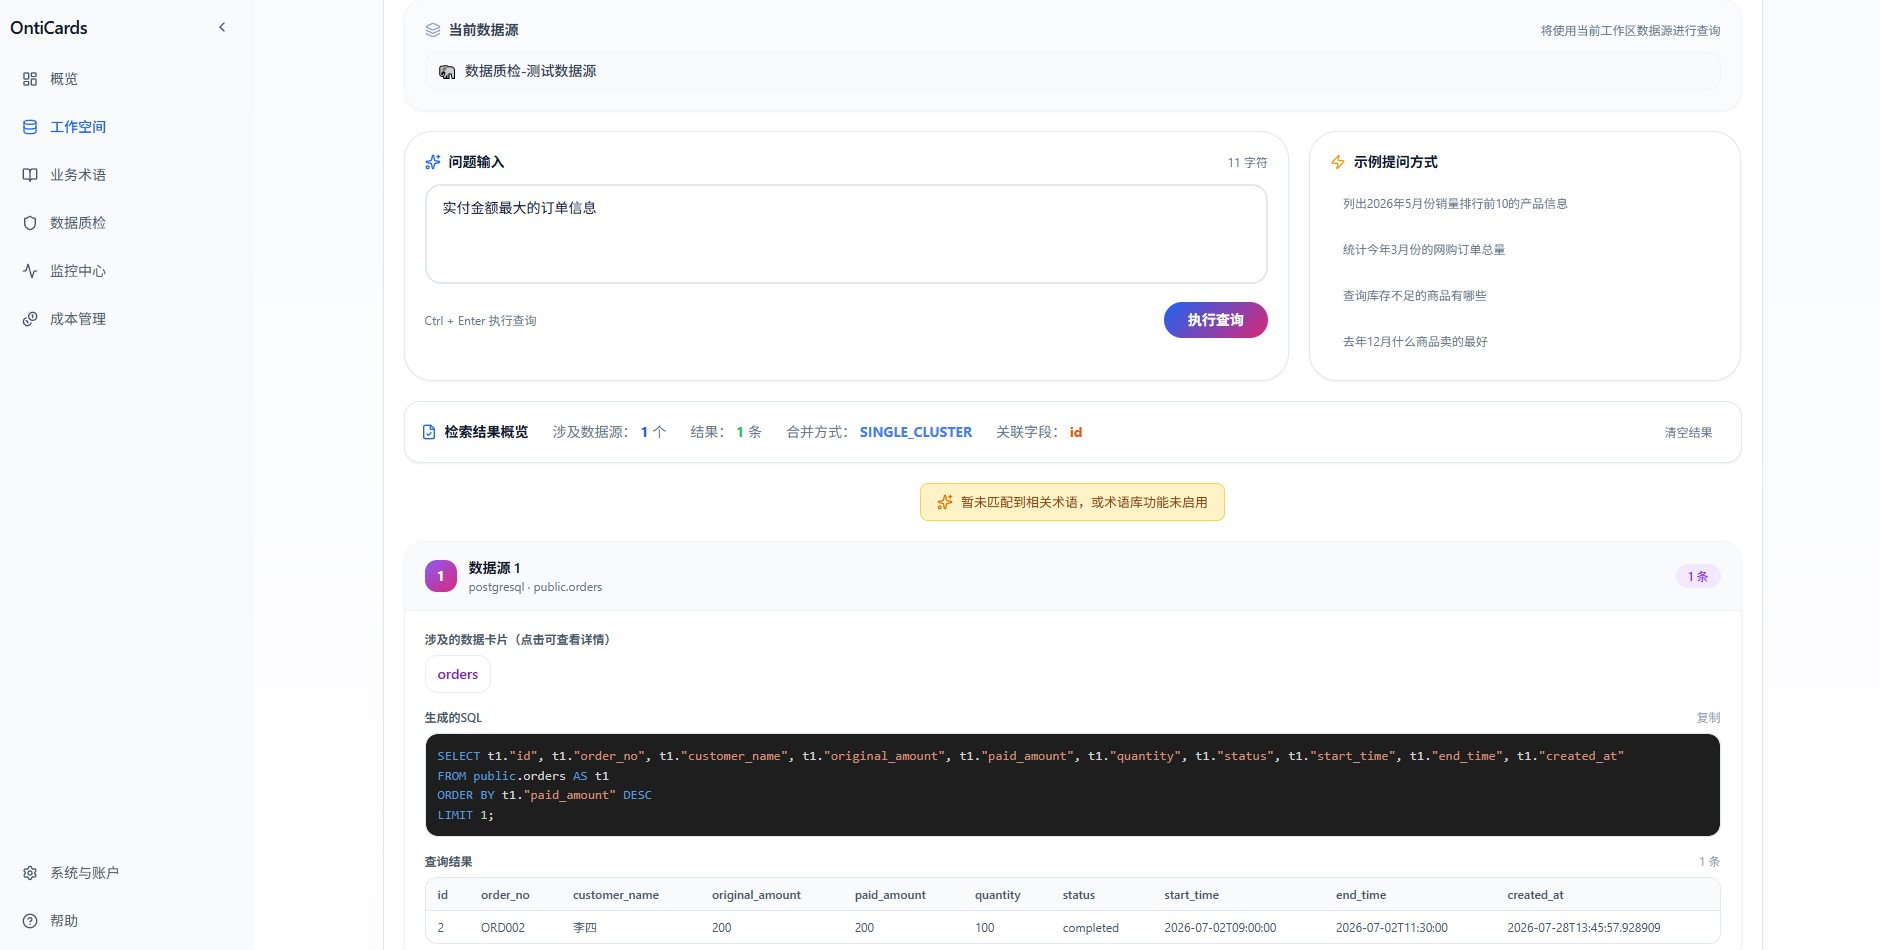
As shown above, the query result area consists of 4 main blocks:
| Block | Description |
|---|---|
| Retrieval result overview | Shows 1 data source involved / 1 result / merge method SINGLE_CLUSTER / key field id, with a "Clear results" quick action on the right |
| Involved data sources | The matched card public.orders, with a 1 result badge on the right indicating the hit count |
| Generated SQL (dark code block) | Fully copyable, with the hint "no related glossary matched yet" at the bottom |
| Query result table | Tabular display of the returned field values, with "Copy / Explain" actions in the rightmost column |
4.6 Knowledge (Business Glossary)
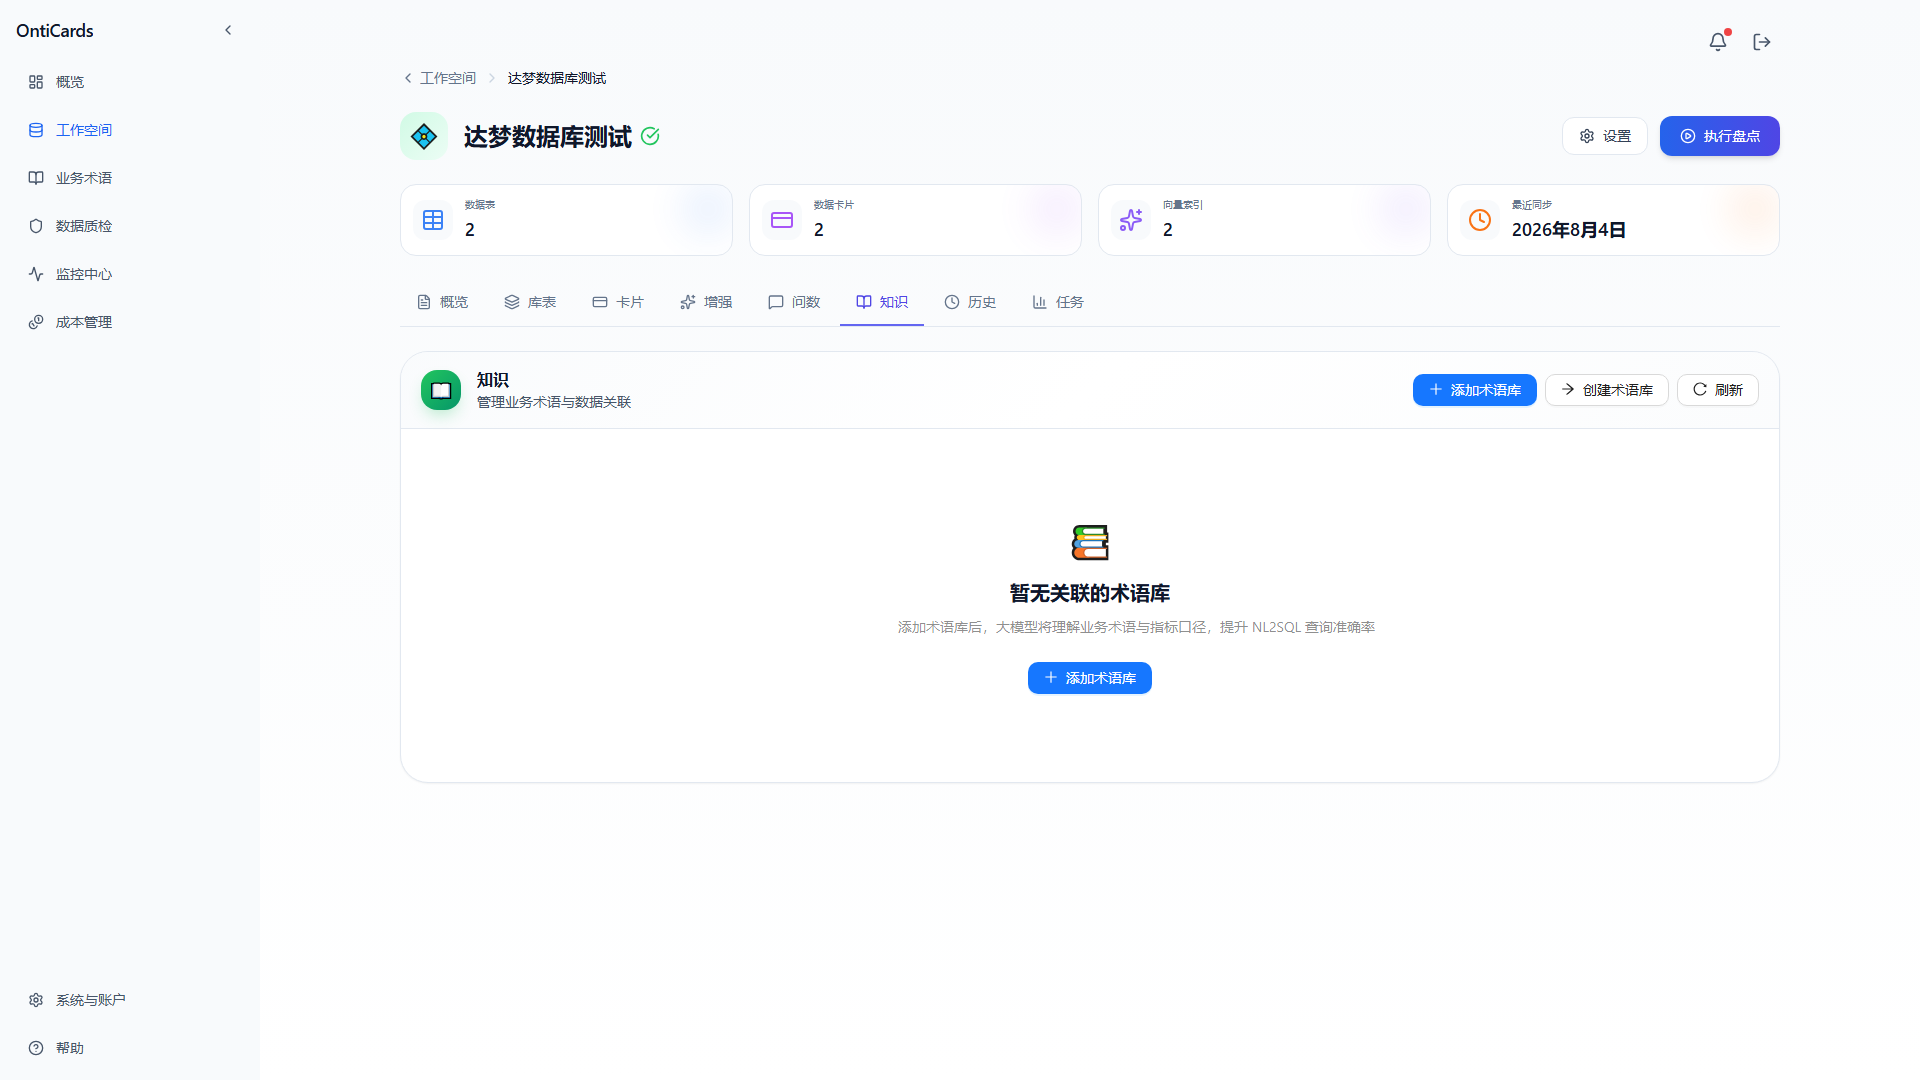
The Knowledge tab manages business glossaries linked to this data source:
- Lists the glossaries already linked to this data source
- Provides "Add glossary", "Create glossary", and "Refresh" actions
- Shows an empty-state guide when no glossary is linked yet
📚 For creating and managing glossaries, see Chapter 6 Business Glossary.
4.7 History
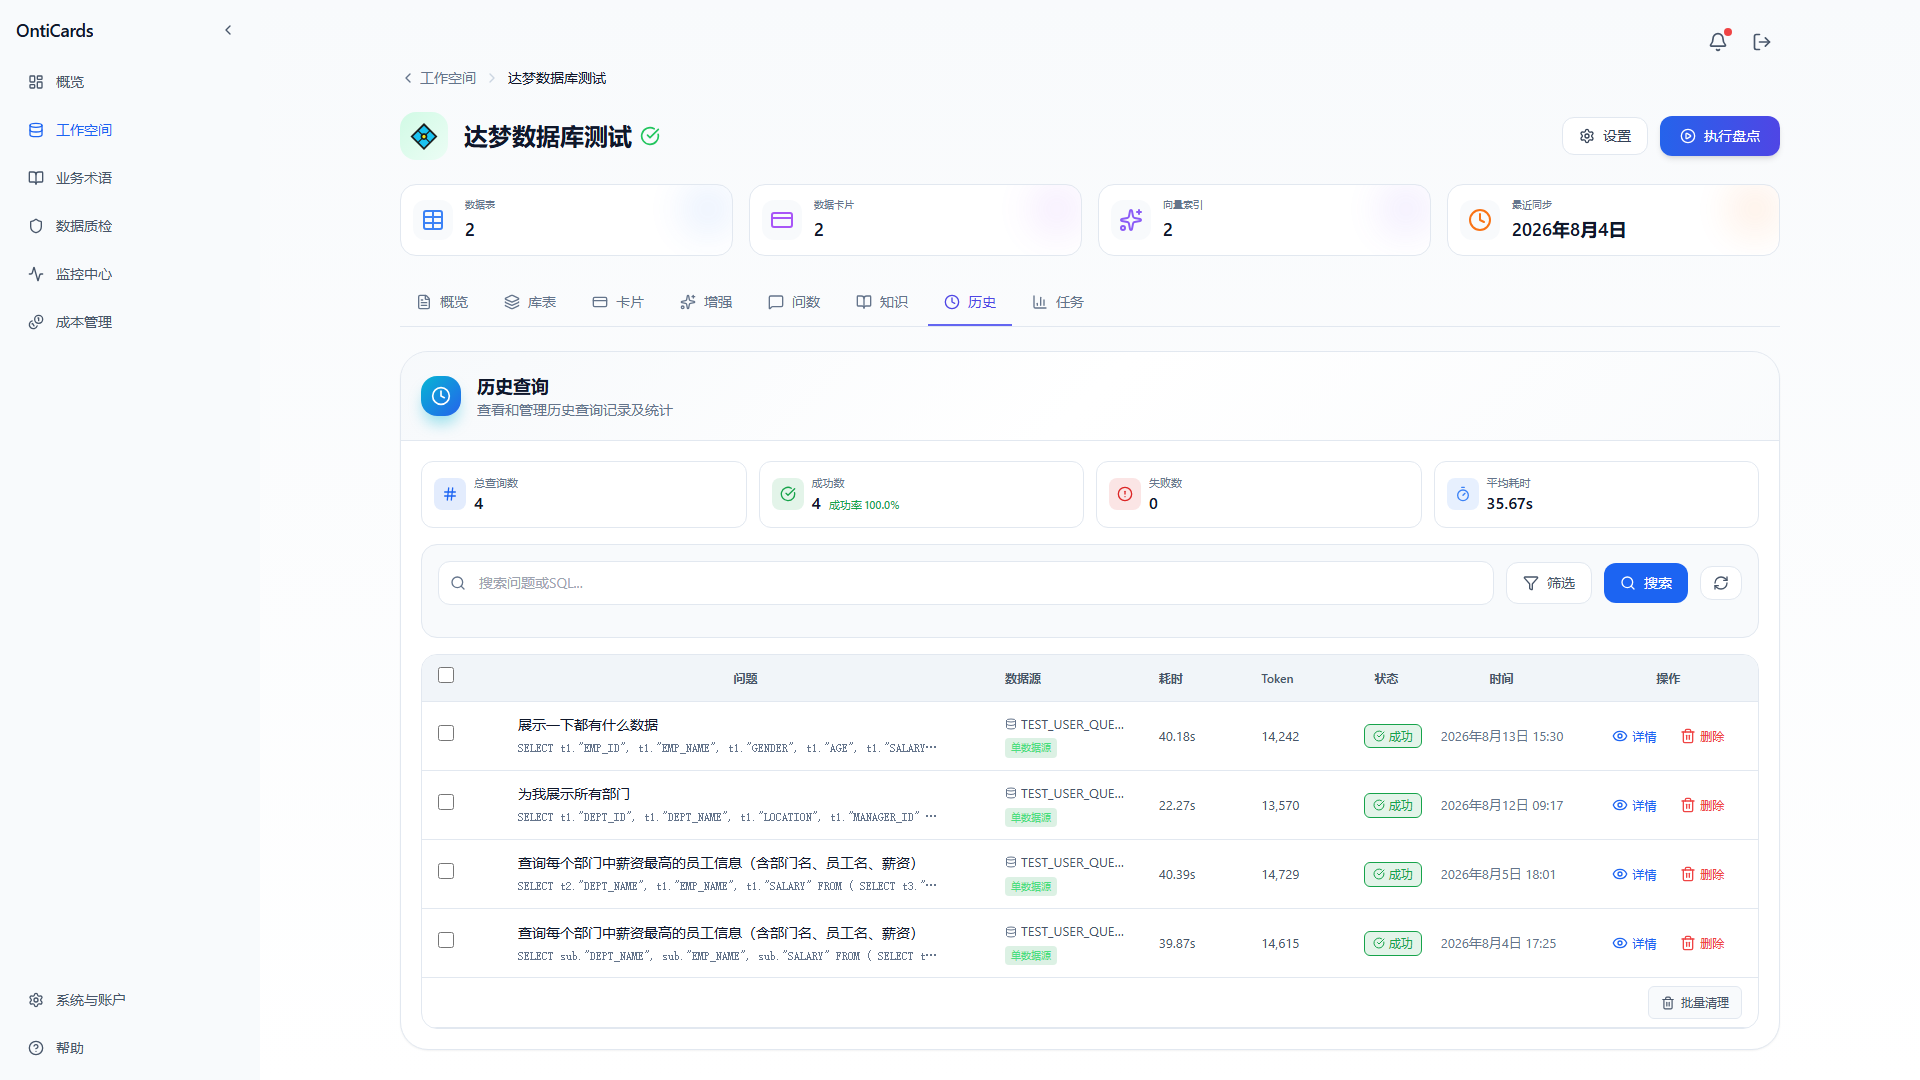
The History tab shows all historical query records for this data source:
Top statistics: total queries, success rate, failure count, average duration
Filtering and search:
- Search box: search by question keyword or generated SQL fragment
- Filter button: filter by time range, table, or status
- Search button: apply the filter
- Export button: export the current results
Query record list:
| Column | Description |
|---|---|
| Question | The natural-language question entered by the user |
| Data source | The data sources involved |
| Duration | Total duration of the query (milliseconds) |
| Token | Token consumption |
| Status | Success / Failed / Timeout |
| Time | Time of the question |
| Actions | Details (view full SQL and results) / delete |
Click "Details" to view:
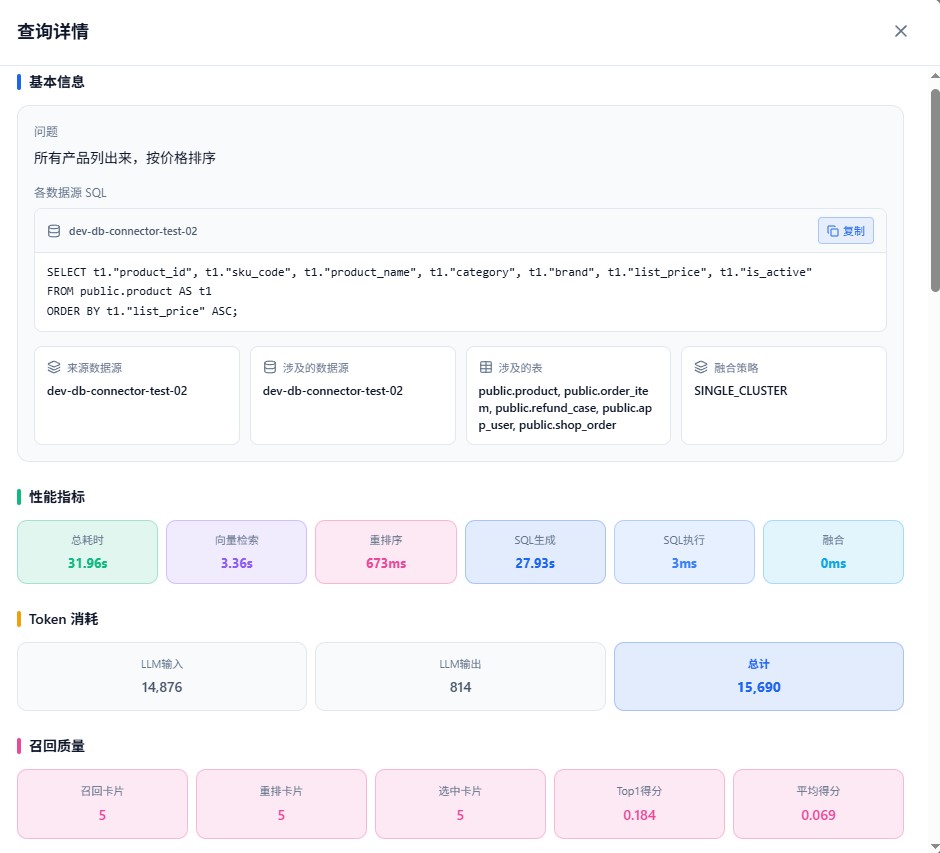
The query detail panel contains 6 blocks of information:
① Basic information
- Original question (e.g. "list all products, sorted by price")
- Involved data source information
- The complete generated SQL (with a "Copy" button)
- Origin / data sources involved
- The list of tables involved
- Merge strategy (e.g.
SINGLE_CLUSTER/MULTI_CLUSTER)
② Performance metrics
| Metric | Meaning |
|---|---|
| Total duration | End-to-end time from question submission to result return |
| Vector retrieval | Time to recall data cards / tables |
| Reranking | Time to rerank the recalled results |
| SQL generation | Time for the LLM to generate SQL |
| SQL execution | Time to execute the SQL in the database |
| Fusion | Time to align and merge cross-source results |
③ Token consumption
- LLM input tokens
- LLM output tokens
- Total
💡 Monitoring the Token consumption of every query helps with cost management (see Chapter 11 Cost Management).
④ Recall quality
| Metric | Meaning |
|---|---|
| Recalled | Total number of candidate tables / cards |
| Reranked | Number of candidates after reranking |
| Selected | Number of tables / cards finally adopted |
| Top1 score | Semantic relevance between the top-ranked candidate and the question (0~1) |
| Average score | Average relevance of all candidates |
🎯 A Top1 score below 0.5 usually means the question is not clearly phrased or the business terms are not covered. Adjust accordingly using the suggestions in Chapter 5 Improving Query Results.
⑤ Data cards involved: click to view the data card details
⑥ Query result record: the results of this query (presented as a table)
4.8 Tasks (Data Discovery)
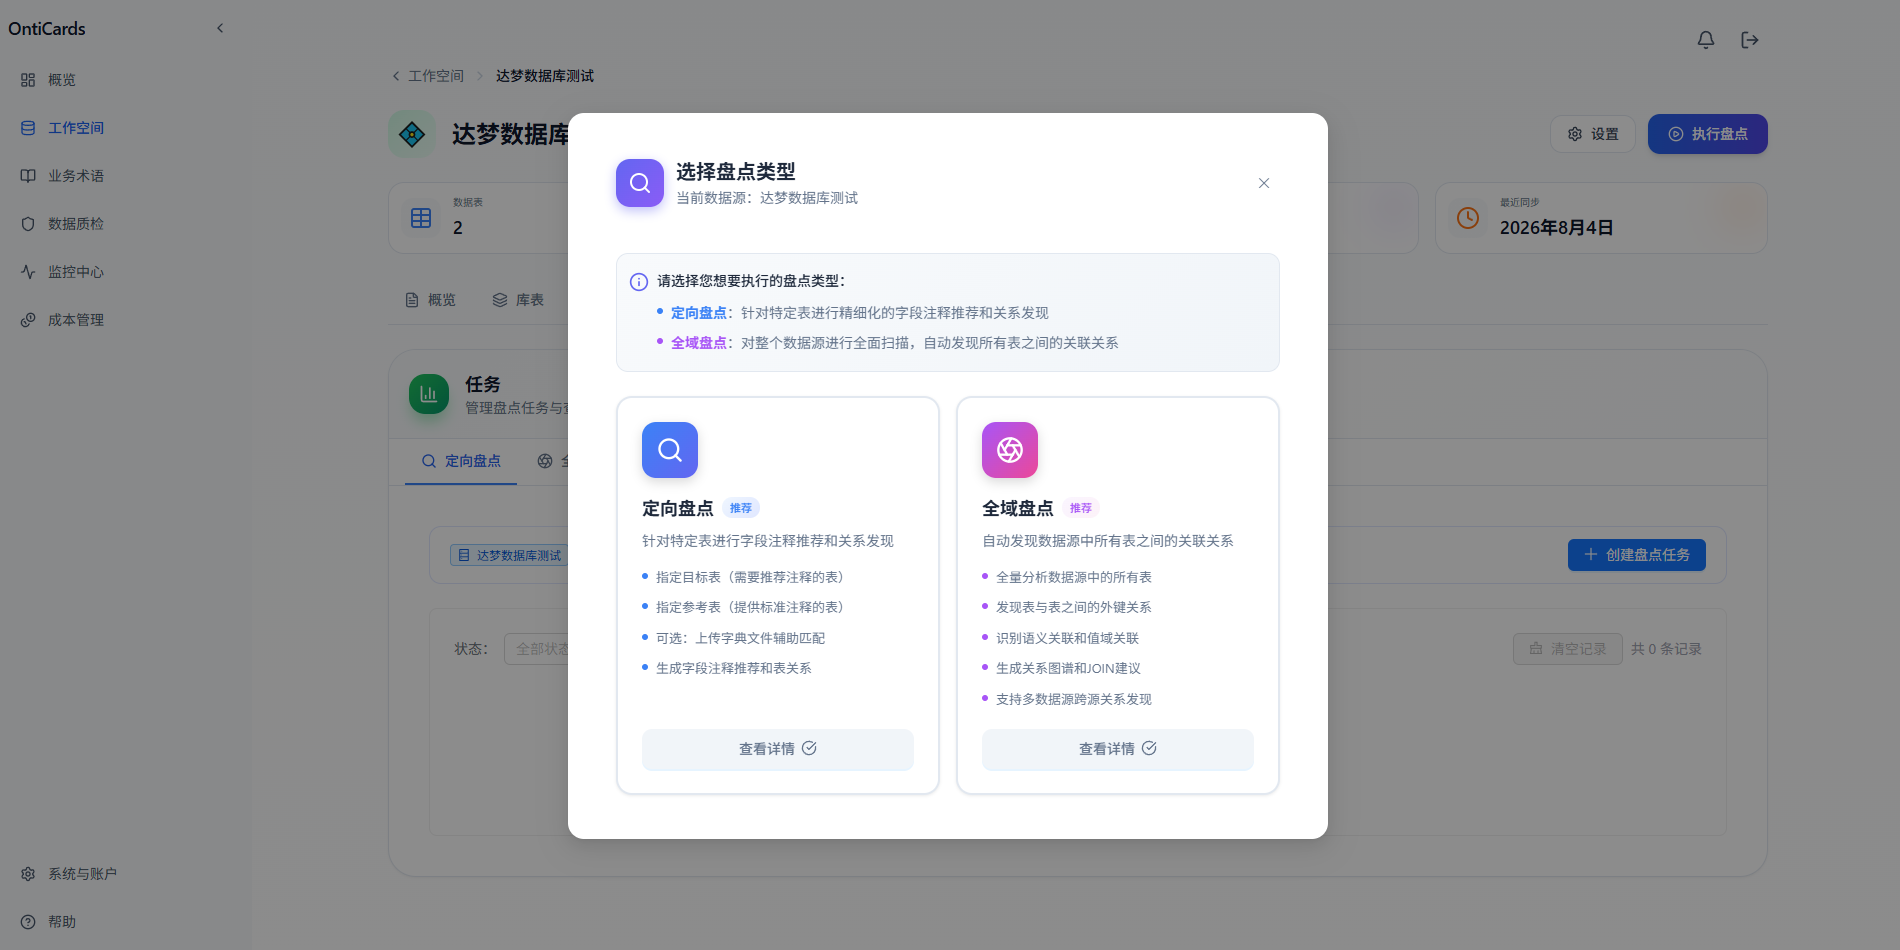
The Tasks tab (or the Run Discovery button in the top right) is used to manage and start data discovery tasks. These analyze the relationships between tables, and the results are used to:
- Improve the accuracy of multi-table JOIN queries
- Automatically generate relationship cards
- Uncover potential data relationships
Two discovery modes are supported:
- Targeted discovery: select target tables and reference tables for fine-grained discovery
- Full discovery: run a holistic discovery over all tables in the database
Creating a targeted discovery task:
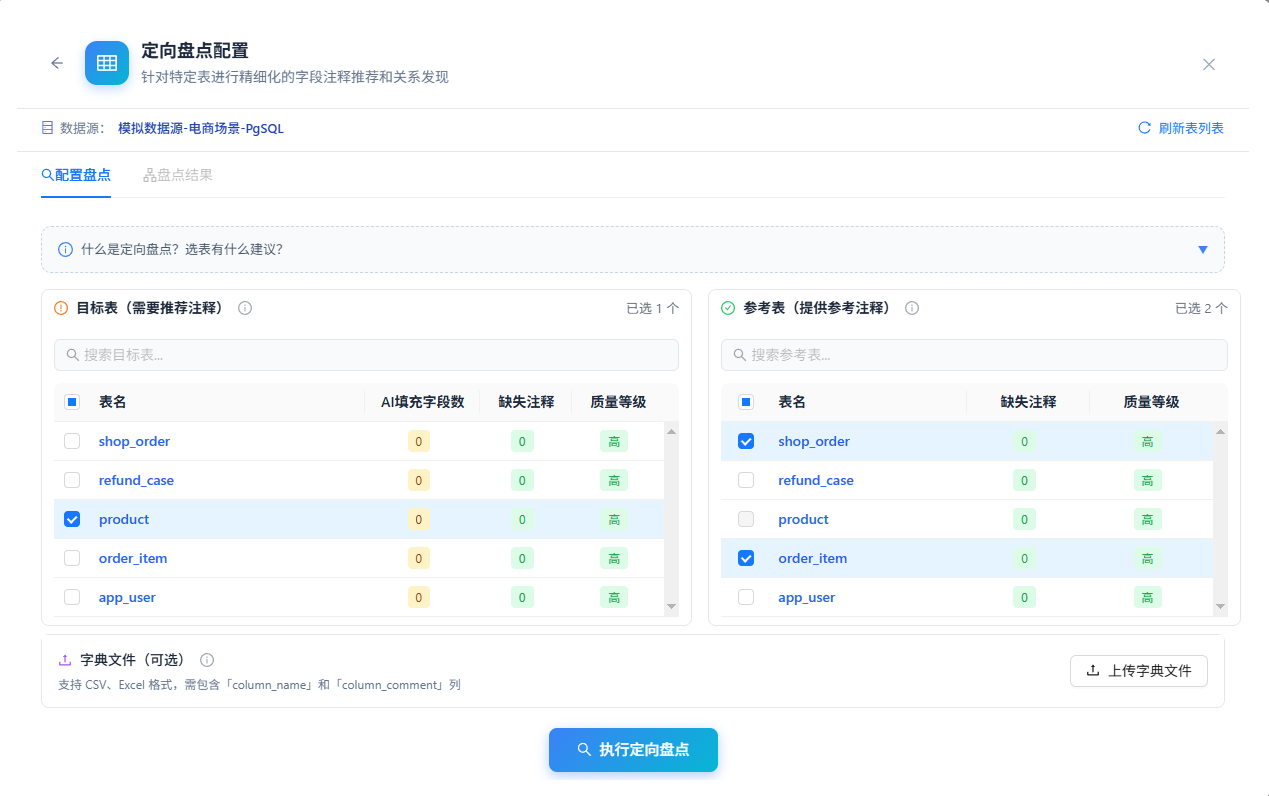
Steps:
- Click Create Discovery Task to open the "Targeted Discovery Configuration" page
- In the "Target tables (need recommended comments)" area, check the tables that need relationship recommendations (e.g.
product)
- In the "Reference tables (provide reference comments)" area, check the tables that provide candidate relationships (e.g.
shop_order,order_item)
- (Optional) Upload a dictionary file (CSV / Excel, must contain
column_nameandcolumn_commentcolumns)
- Click Run Targeted Discovery; the system starts analyzing
Viewing discovery results · table relationship confirmation:
After discovery completes, switch to the "Discovery Results" tab to see the system-recommended relationships:
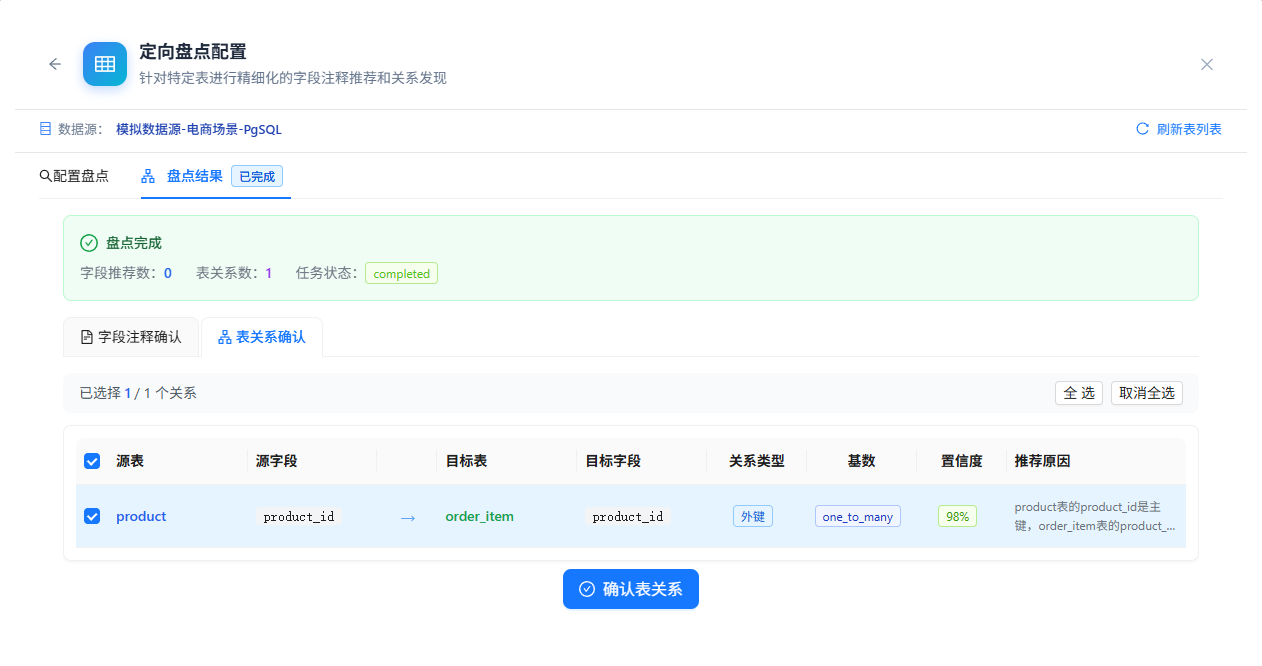
| Field | Description |
|---|---|
| Source table / field | The known starting point (e.g. product.product_id) |
| Target table / field | The candidate end point (e.g. order_item.product_id) |
| Relationship type | Foreign key / same-name field / business association |
| Cardinality | one_to_one / one_to_many, etc. |
| Confidence | How much the system trusts this recommendation (0~100%) |
| Recommended reason | The model's rationale for the judgment |
✅ Check the relationships you confirm, then click Confirm Table Relationships to generate relationship cards.
Discovery results · relationship graph view:
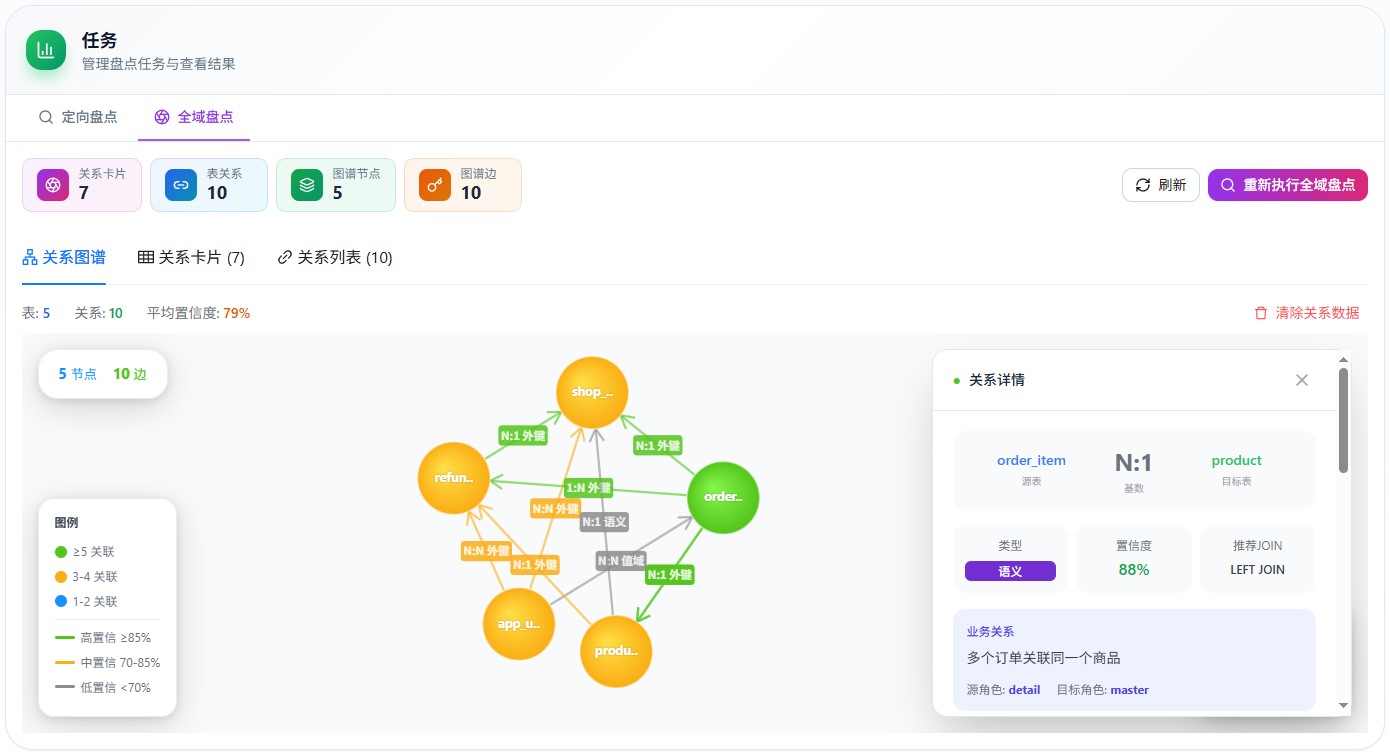
In the "Discovery Results" tab, switch to the "Relationship Graph" sub-view for a more intuitive look at the relationship lines between tables and the overall connectivity — useful for understanding the data model globally.
Relationship card details:
Click a confirmed relationship to open its "Relationship Card" details page:
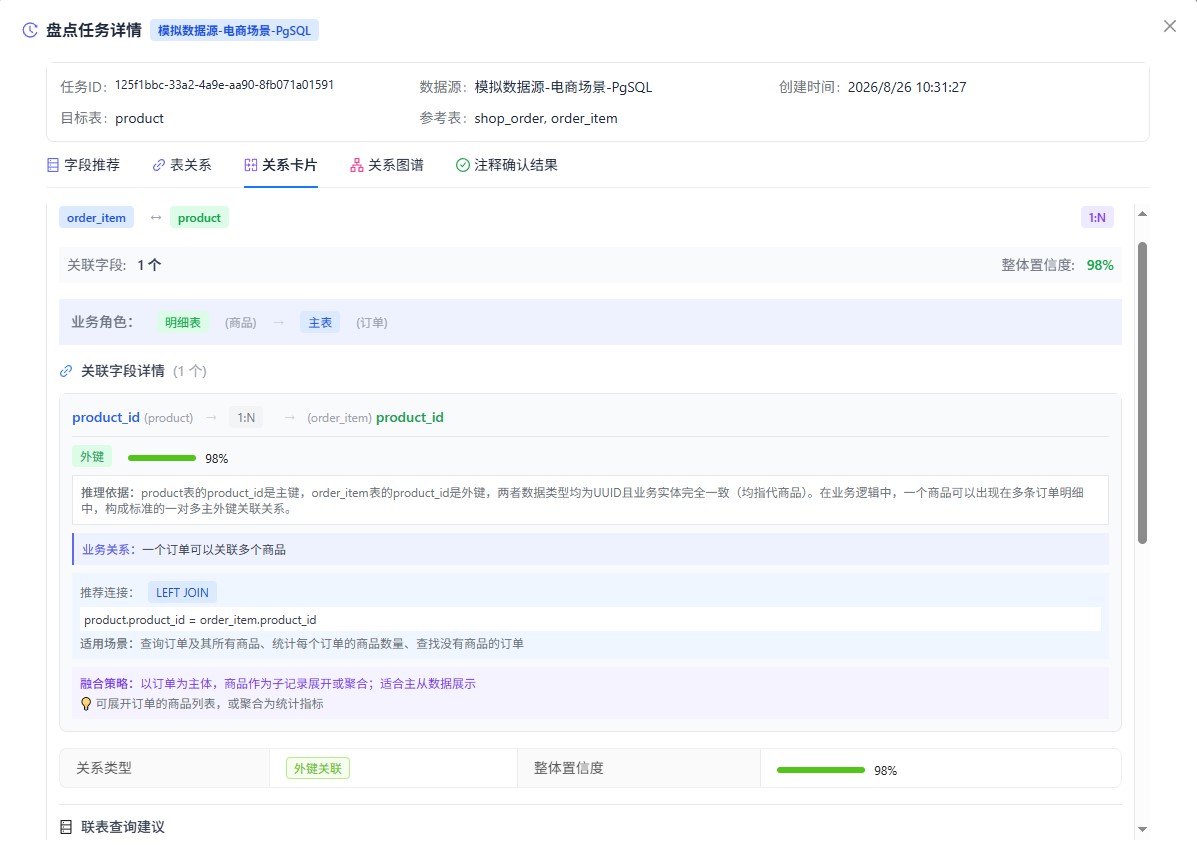
A relationship card explains the meaning of a relationship in business language, including:
- Linked fields: the fields involved (e.g.
product.product_id↔order_item.product_id)
- Business meaning: explains in natural language "why these two tables can be joined this way"
- Business roles: clarifies the role of the master table (products) and the detail table (orders)
- Relationship type: foreign key / same-name field / business inference
- Recommended join:
LEFT JOIN/INNER JOIN/ full join
- Recommendation basis: why the model makes this recommendation (e.g. matching field types, similar value distributions)
- Overall confidence: the model's overall score for the relationship (e.g. 98%)
- Applicable scenarios: what kind of business questions this relationship answers
- Fusion strategy suggestion: pre-aggregation suggestions based on the master-detail data
- Join query suggestion: a ready-to-use SQL template
🔍 More operational details on data discovery are in Chapter 7 Data Discovery.
5. AI Query (Natural-Language Query)
5.1 Basic Queries
Type everyday questions into the input box of the Query tab, for example:
- List the top 10 products by sales ranking in May 2025
- Count the total number of orders by department in March this year
- Find products whose inventory is insufficient
- What sold best last December?
Press Enter or click Run Query; the system will:
- Understand the question: identify the intent, the time range involved, dimensions, and metrics
- Retrieve metadata: match the relevant tables and fields
- Generate SQL: produce executable SQL in the database's dialect
- Safety check: block any non-SELECT statements
- Execute the query: run the SQL and return the results
- Present the results: display them as tables and charts
5.2 Multi-Step Reasoning Queries
OntiCards supports multi-step reasoning. The system breaks a complex question into multiple sub-questions, executes them in sequence, and merges the results.
Example question:
"Which were the top 10 products by sales last month, and what are their current inventory levels?"
The system breaks it down into:
- Get the top 10 products by sales last month
- Look up the current inventory of those 10 products
- Merge the two result sets
5.3 Cross-Source Join Queries
Prerequisites:
- Multiple data sources have been added
- A business glossary is configured and enabled
- Switch to Multiple data sources mode
Example question:
"Compare orders from the e-commerce system with customer profiles in CRM — which VIP customers have not placed an order in the last 3 months?"
The system will:
- Determine that the "order database" and "CRM database" need to be queried
- Find orders from the last 3 months in the order database
- Find VIP customers in the CRM database
- Align the cross-database results
Cross-database query example (input stage):
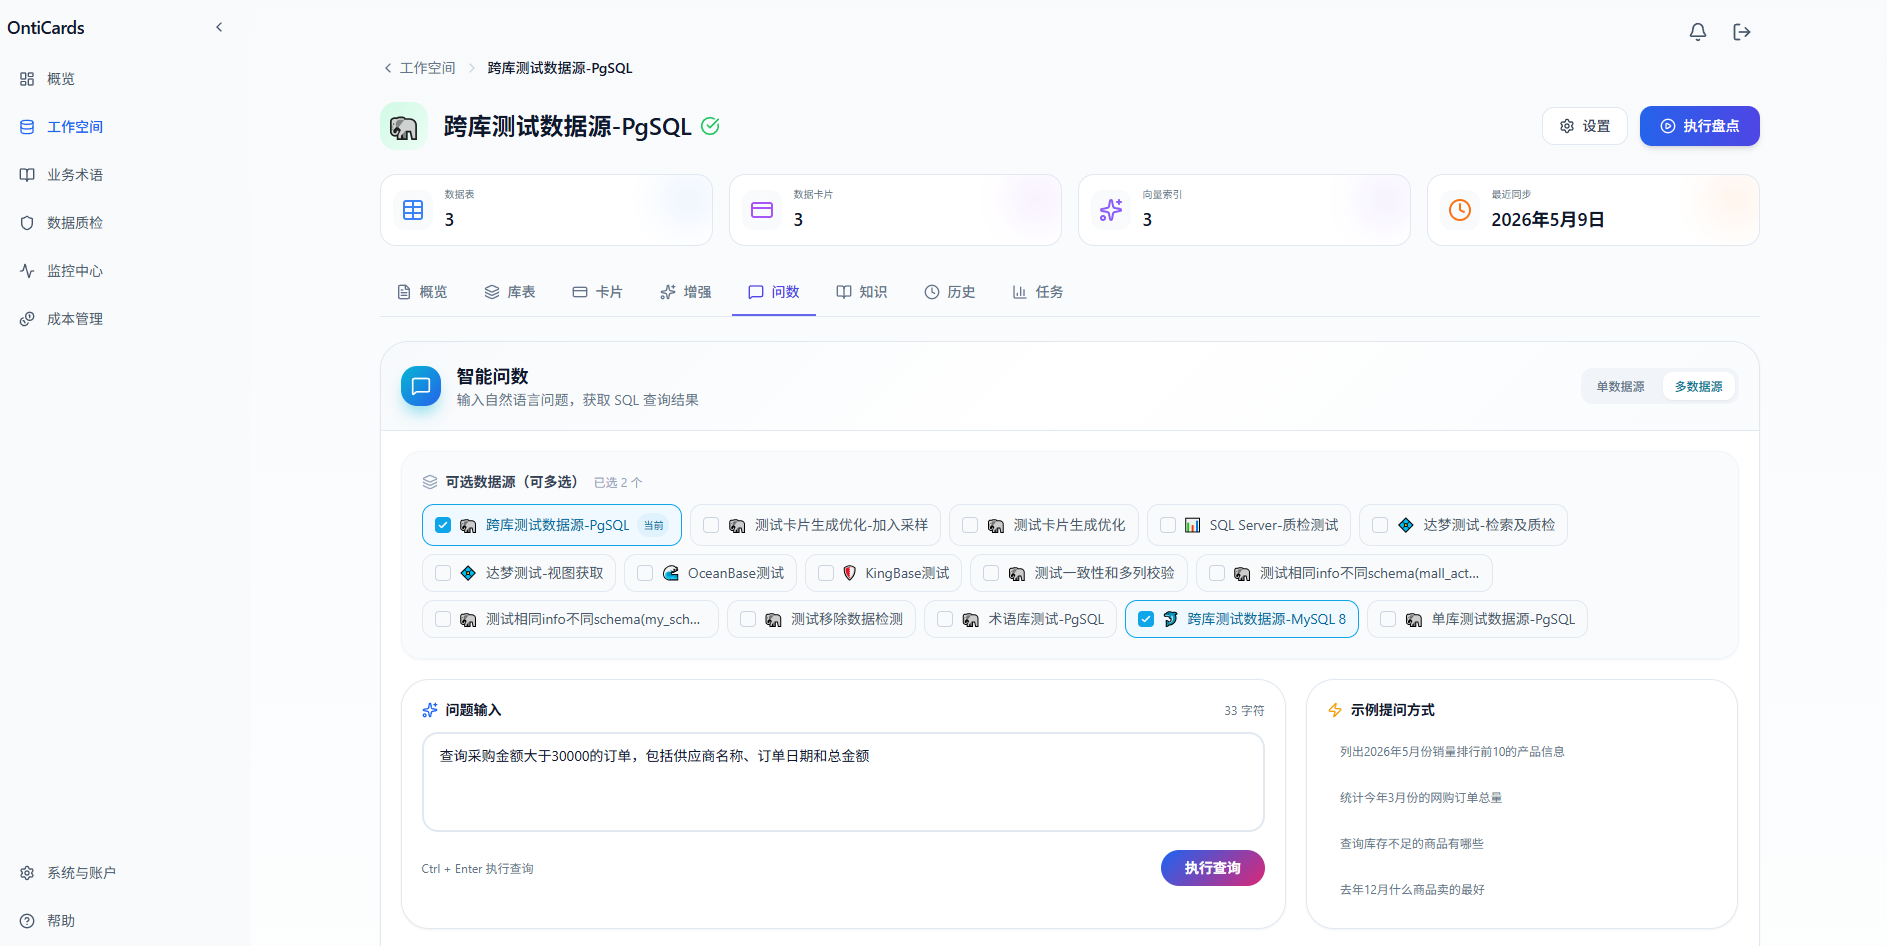
As shown above:
- Top statistics area: 3 tables / 3 data cards / 3 queries / last synced May 9, 2026
- Multiple data source toggle: "Multiple data sources" is enabled (single ↔ multiple toggle in one click)
- Selectable data sources (multi-select): 14 data sources can be checked; 2 are selected (highlighted)
- Question input area: asking "Query orders with purchase amount greater than 30000, including supplier name, order date, and total amount" — 33 characters
- Example question patterns (right side): click to fill in a question quickly
Cross-database result fusion (output stage):
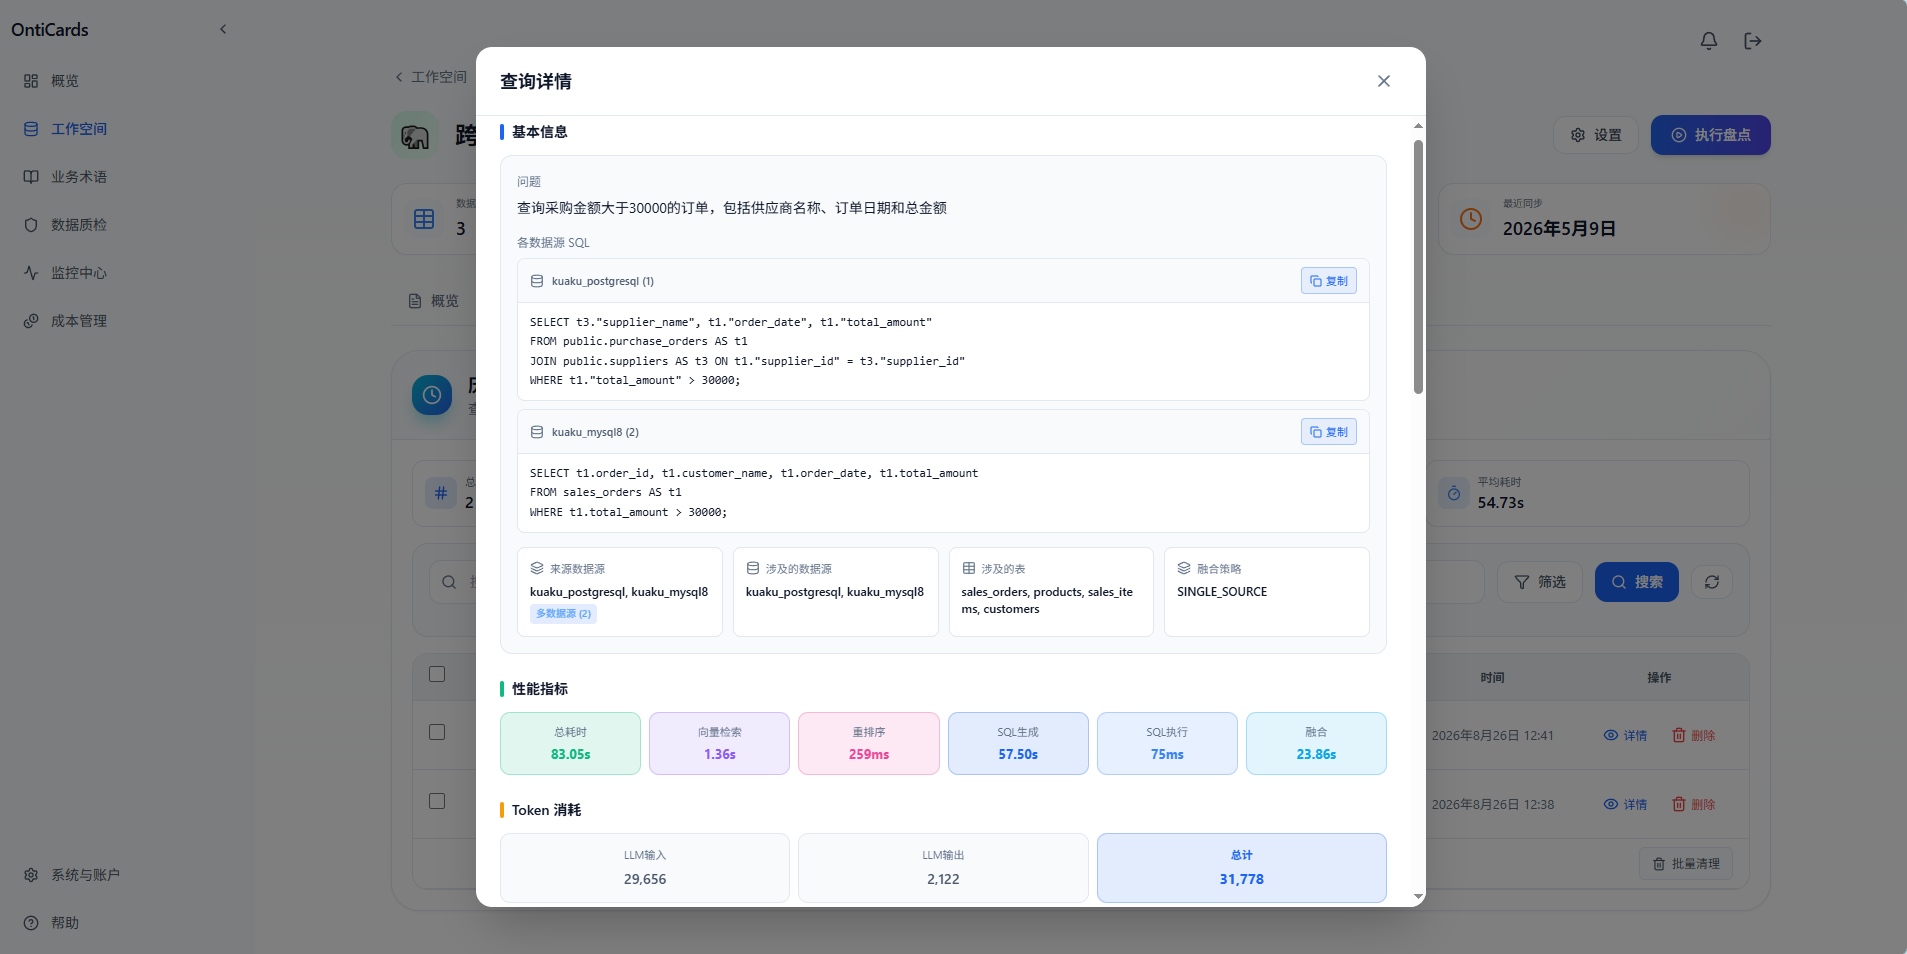
The query detail dialog clearly shows the full cross-source join pipeline:
| Block | Key content |
|---|---|
| Basic information | User question, SQL for viewing the data |
| Per-source SQL (two segments) | - kuaku_postgresql: purchase_orders JOIN suppliers, filtered on total_amount > 30000 |
- kuaku_mysql: sales_orders filtered on total_amount > 30000 | |
| Related info (4 cards) | Source data source / related data sources / tables involved (purchase_orders + suppliers + sales_orders + products + customers) / fusion metric SINGLE_SOURCE |
| Performance metrics | Total 83.05s / vector retrieval 1.36s / reranking 259ms / SQL generation 57.50s / SQL execution 75ms / fusion 23.86s |
| Token consumption | LLM input 29,656 / LLM output 2,122 / total 31,778 |
💡 The fusion method for cross-database queries (SINGLE_SOURCE/MULTI_CLUSTER/JOIN_FUSION, etc.) is chosen automatically by the system based on question complexity; the detail view shows the duration of each step.
5.4 Interpreting Query Results
The query result page usually contains the following information:
- Data table: the core data returned by the query
- Data origin: explicitly marks which database and which tables the data came from
- The time range recognized
- The filters recognized
- The tables and fields selected
- The business terms applied
- Query explanation: how the system understood your question, including:
- Generated SQL: copyable in one click
- Hints and warnings: which conditions were recognized, which were ignored, and why
A real query result example:
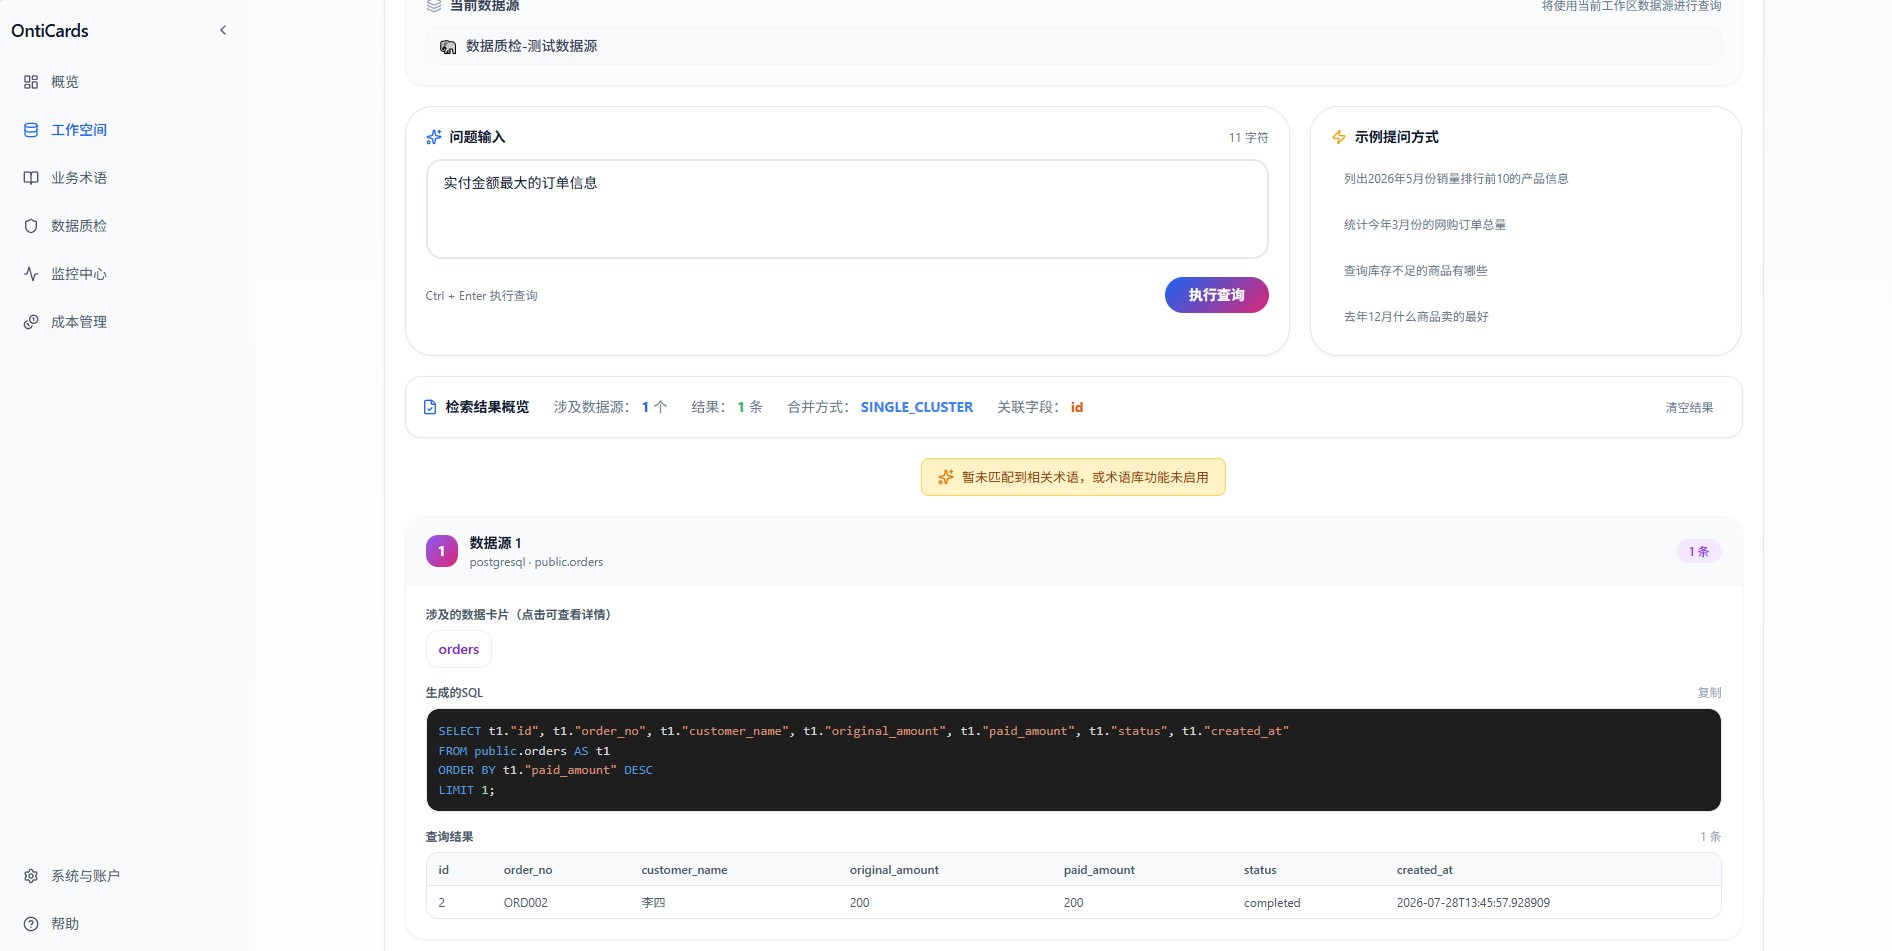
As shown above, after asking "order information with the largest paid amount", the system returns:
- Retrieval result overview: 1 data source involved, 1 result returned, merge method
SINGLE_CLUSTER, key fieldid
- Data source 1 (1 result): the related card is
public.orders
- Generated SQL (highlighted code block, one-click copy / copy / explain):
  SELECT t1."id", t1."order_no", t1."customer_name",
         t1."original_amount", t1."paid_amount",
         t1."status", t1."created_at"
  FROM public.orders AS t1
  ORDER BY t1."paid_amount" DESC
LIMIT 1;- Query result table: shows the key field values (
id/order_no/customer_name/original_amount/paid_amount/status/created_at)
💡 When no related glossary is configured, the system shows a hint at the bottom: "No related glossary matched, or the glossary feature is not enabled". You can create one as needed in Chapter 6 Business Glossary.
5.5 Improving Query Results
If the results are not what you expected, check the following in order:
- Review the "Query explanation": understand how the system parsed the question
- Enrich the data card: the richer the table and field descriptions, the more accurate the querying (adjust manually or upload a dictionary file)
- Enrich the business glossary: explicitly define business concepts such as "high-value customer" so the system understands domain terms
- Add a time range
- Specify the sort order
- Specify the output format
- Adjust how you ask: express your intent more specifically
- Run data discovery: add table relationships to improve JOIN accuracy
Questioning tips:
| Scenario | Poor question | Better question |
|---|---|---|
| Time range | "recent orders" | "orders in the last 30 days" |
| Sorting | "customers with the most" | "top 10 customers by spending" |
| Dimension | "product sales" | "total sales grouped by category" |
| Filtering | "active users" | "users who logged in in the last 7 days" |
6. Business Glossary
6.1 What Is a Business Glossary
A glossary explicitly defines your company's internal business concepts, so the system truly "understands business language".
Typical examples:
| Business term | How the system understands it |
|---|---|
| High-value customer | VIP level IN ('Diamond','Gold') AND cumulative spending > 10000 |
| Core product | product category IN ('A','B') |
| Active user | login count >= 3 in the last 30 days |
| Slow-moving product | in stock for more than 90 days AND sales < 10 |
6.2 Creating a Glossary
Go to the Business Terms page:
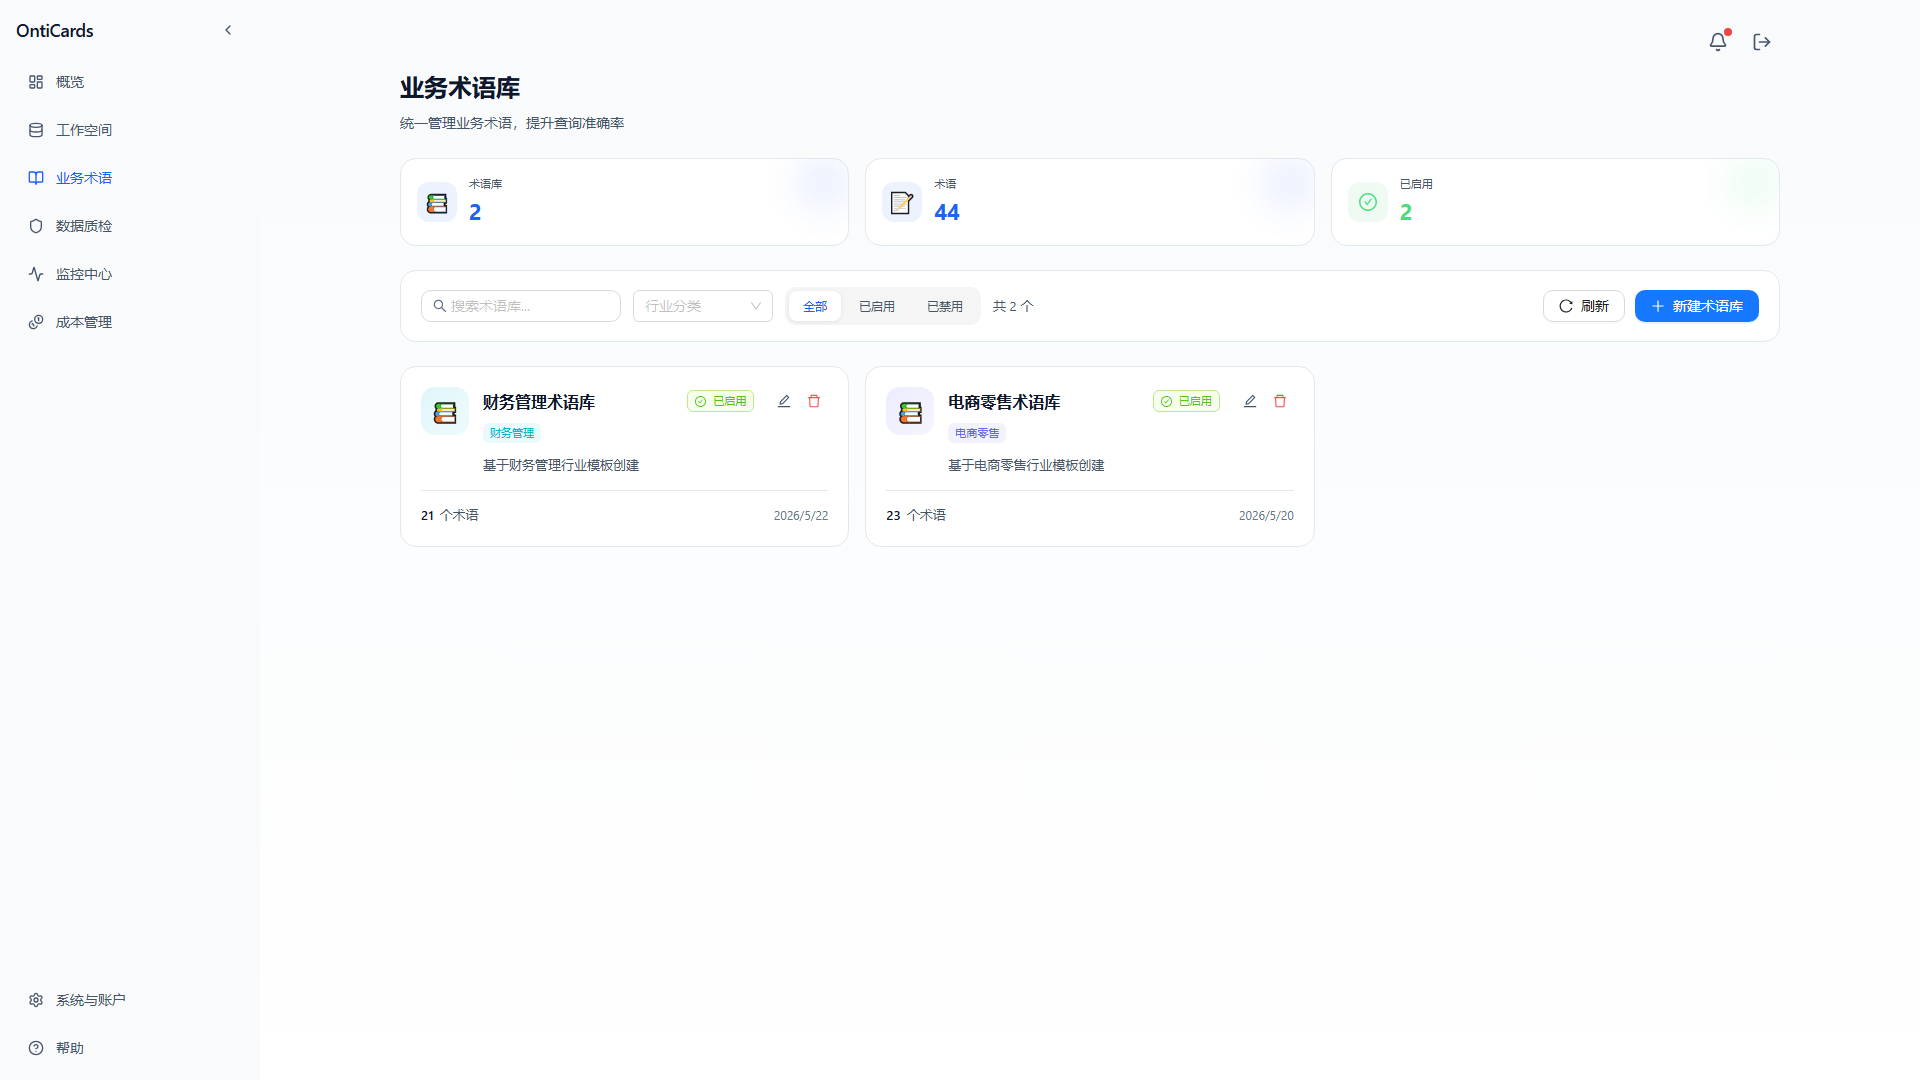
Steps:
- Click the New Glossary button
- Glossary name (e.g. "Sales glossary")
- Industry category (optional)
- Description (explains the scope of the glossary)
- Fill in:
- Term name: the business metric (e.g. "high-value customer")
- Alias/synonyms: optional (e.g. "VIP customer", "key customer")
- Definition: defined as an SQL expression or in natural language
- Linked fields: linked to specific database.table.field
- Add business terms inside the glossary; each term contains:
- Enable the glossary (it is only used in querying after the switch is turned on)
💡 The system provides industry templates such as the "Finance glossary" and "E-commerce retail glossary" as starting points.
Glossary detail example (Finance glossary):
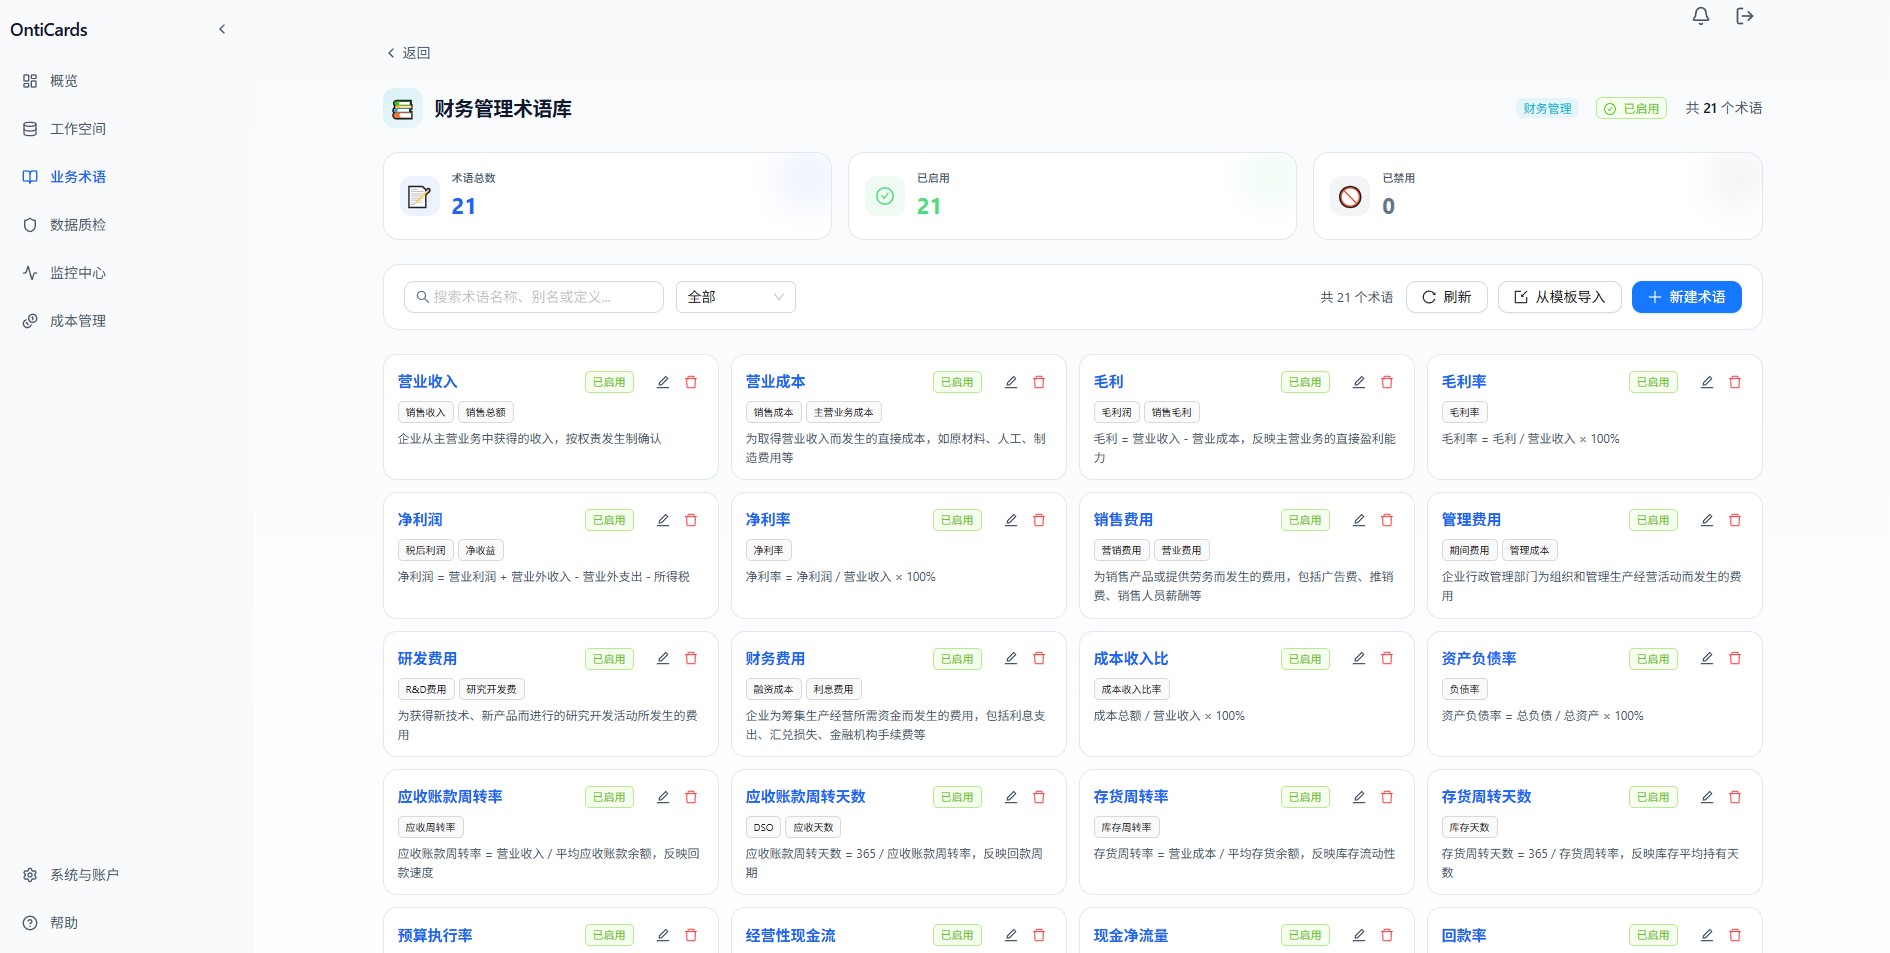
As shown above, entering the "Finance glossary" shows a complete list of term cards. Each card contains:
- Term name: e.g. "Operating revenue", "Operating cost", "Gross profit", "Gross margin", "Net profit", etc.
- Status badge: "Enabled" / "Disabled", toggled in one click
- Alias / synonyms: multiple supported (e.g. "Gross margin" corresponds to "Gross profit")
- Type tag: marks the term's category (sales / cost / expense / asset / risk, etc.)
- Definition: natural language plus a formula (e.g. "Gross margin = Gross profit / Operating revenue × 100%")
Quick reference of common finance terms:
| Category | Term | How the system understands it |
|---|---|---|
| Revenue | Operating revenue | Income earned from business operations, recognized on an accrual basis |
| Revenue | Operating cost | Direct costs incurred to earn revenue, such as raw materials, labor, and manufacturing overhead |
| Profit | Gross profit | Operating revenue − operating cost; reflects the profitability of core business and direct cost control |
| Profit | Gross margin | Gross profit / operating revenue × 100% |
| Profit | Net profit | Operating revenue − operating cost − non-operating income − non-operating expense − income tax expense |
| Profit | Net margin | Net profit / operating revenue × 100% |
| Expense | Selling expense | Costs incurred to sell products or services, including advertising, salesperson salaries, and sales organization expenses |
| Expense | Administrative expense | Costs incurred by corporate administration for production and operations |
| Risk | Debt-to-asset ratio | Total liabilities / total assets × 100% |
| Liquidity | Net cash flow | Cash inflows − cash outflows |
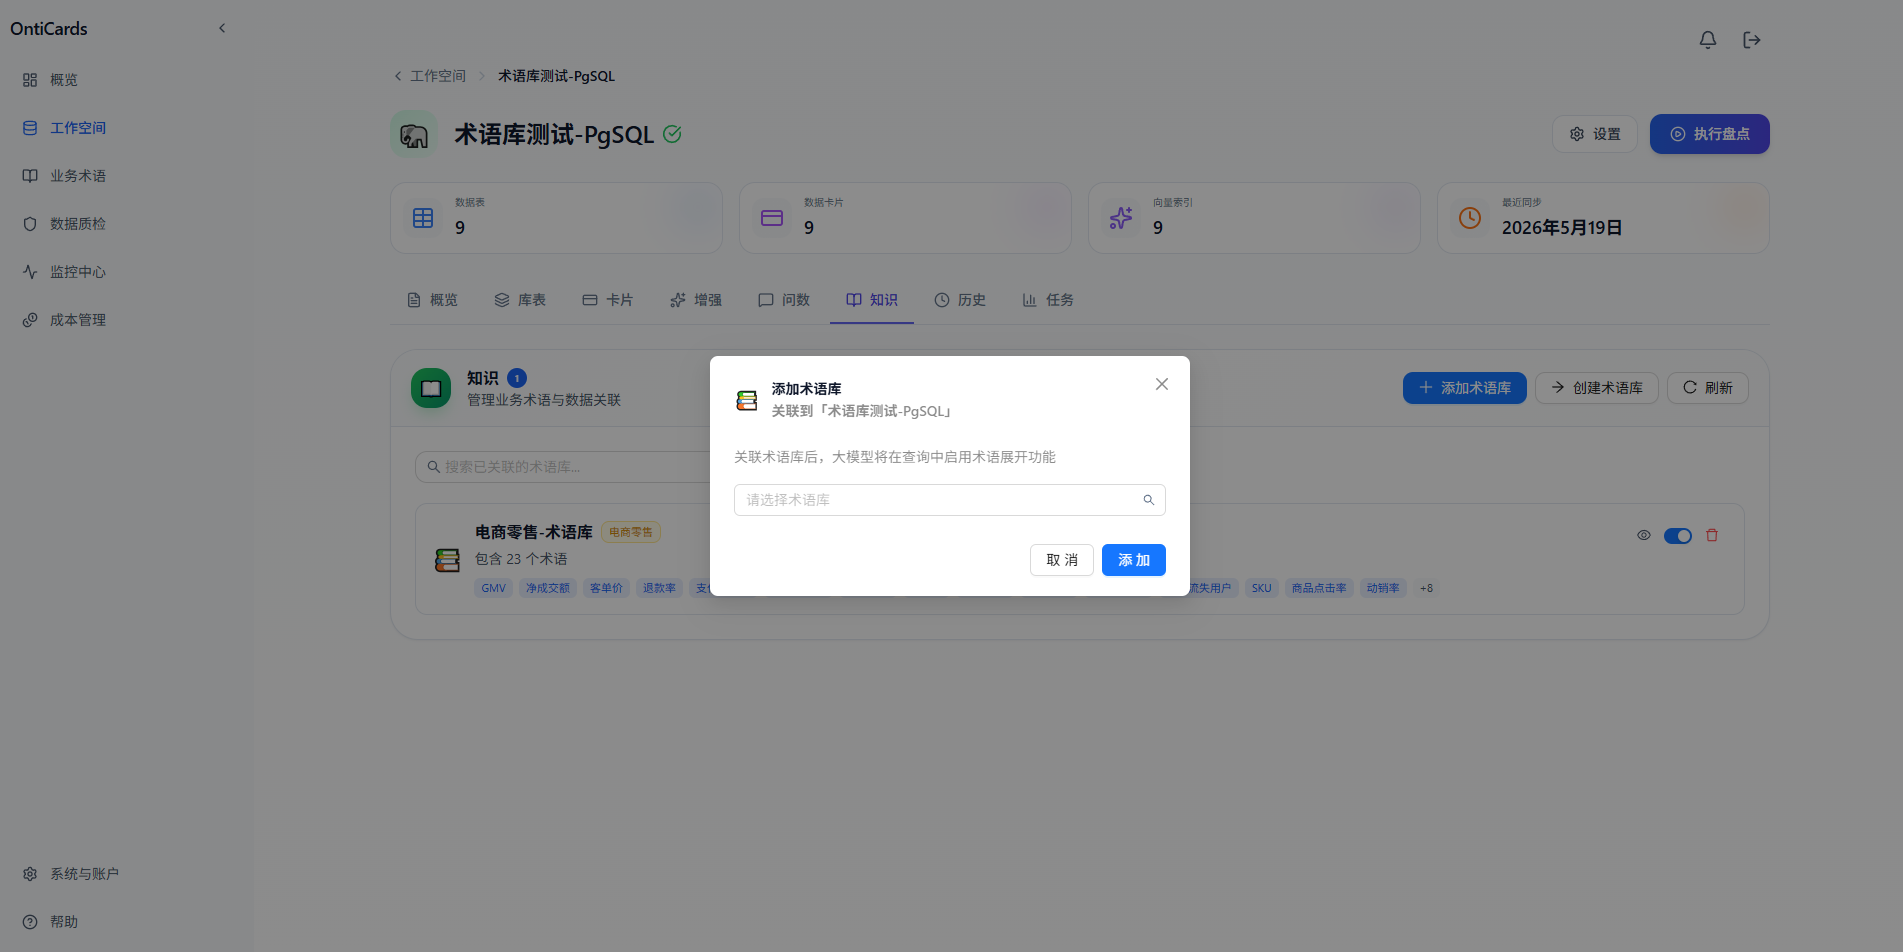
6.3 Linking a Glossary to a Data Source
A created glossary must be linked to a specific data source before it is used.
- Go to the data source details → Knowledge tab
- Click Add Glossary
- Select the target glossary
- After linking, every query on that data source automatically expands the concepts in the glossary
7. Data Discovery
Data discovery is the ability to automatically analyze relationships between tables with AI, significantly improving the accuracy of multi-table JOIN queries.
7.1 Full Discovery
When to use: right after onboarding a data source, when you want the system to automatically discover all table relationships.
Steps:
- Go to the data source details → Tasks tab
- Select the Full Discovery mode
- Click Create Discovery Task
- Wait for the system to finish (more tables mean longer runtime)
- Check the progress and results in the task list
- When done, the system generates relationship cards and applies them to the query engine automatically
7.2 Targeted Discovery
When to use:
- You only want to discover a few core business tables
- The system's recommended relationships are inaccurate and need supplementary references
- You have clear relationship expectations for some tables
Steps:
- Go to the Tasks tab → Targeted Discovery
- Select the target tables (tables that need relationship recommendations)
- Select the reference tables (tables that provide candidate relationships)
- (Optional) Upload a dictionary file to assist field recommendations
- Click Run Targeted Discovery
- The system analyzes and recommends relationships between fields
- After manual confirmation/correction, click Confirm Table Relationships to generate relationship cards
📌 For detailed explanations of the configuration page and the discovery result views, see §4.8 Tasks (Data Discovery).
7.3 Managing Discovery Results
When discovery finishes, the system produces two core artifacts:
- Relationship list (table relationship confirmation view): lists all candidate relationships for one-by-one confirmation
- Relationship cards: every confirmed relationship generates a "relationship card" that is called automatically during querying
Relationship card lifecycle:
- Generation: produced automatically after discovery results are confirmed
- Application: recalled automatically when a query involves the related tables
- Editing: supports manual fine-tuning (business meaning, recommended join, confidence, etc.)
- Rollback: a wrong relationship can be deleted and rediscovered
📌 For relationship card details and field descriptions, see §4.8 Tasks (Data Discovery).
8. Field Comment Enrichment
When the AI-generated data card descriptions are not accurate enough, you can batch-supplement field comments by uploading an Excel data dictionary.
8.1 Preparing the Excel Dictionary File
Requirements:
- File format:
.xlsxor.xls
- File size: ≤ 20MB
- The first worksheet is read by default
- Must contain three columns: table name, field name, field comment (order is flexible; map them at upload time)
Example:
| Table | Field | Field comment |
|---|---|---|
| orders | order_id | Order ID (primary key) |
| orders | user_id | ID of the ordering user |
| orders | amount | Order amount (CNY) |
| orders | created_at | Order creation time |
8.2 Upload and Configuration
- Go to the data source details → Enrichment tab
- Upload the Excel file
- Configure the column mapping:
| Field | Description |
|---|---|
| Table name | Which column in the dictionary holds the table name |
| Field name | Which column in the dictionary holds the field name |
| Field comment | Which column in the dictionary holds the field comment |
- (Optional) Worksheet name: leave blank to use the first worksheet
- Click Start Processing
8.3 Viewing the Enrichment Results
After processing completes:
- The comments of the corresponding fields in the data cards are updated
- The description column for fields in the Tables tab shows the new comments
- Subsequent queries use the enriched comments first
💡 Batch processing tip: dictionary columns can be referenced by Excel column letters (A/B/C/E, etc.) or selected by column name from a dropdown.
9. Data Quality Checks
OntiCards has complete data quality checking built in.
9.1 Managing Rule Libraries
Go to the Data Quality page:
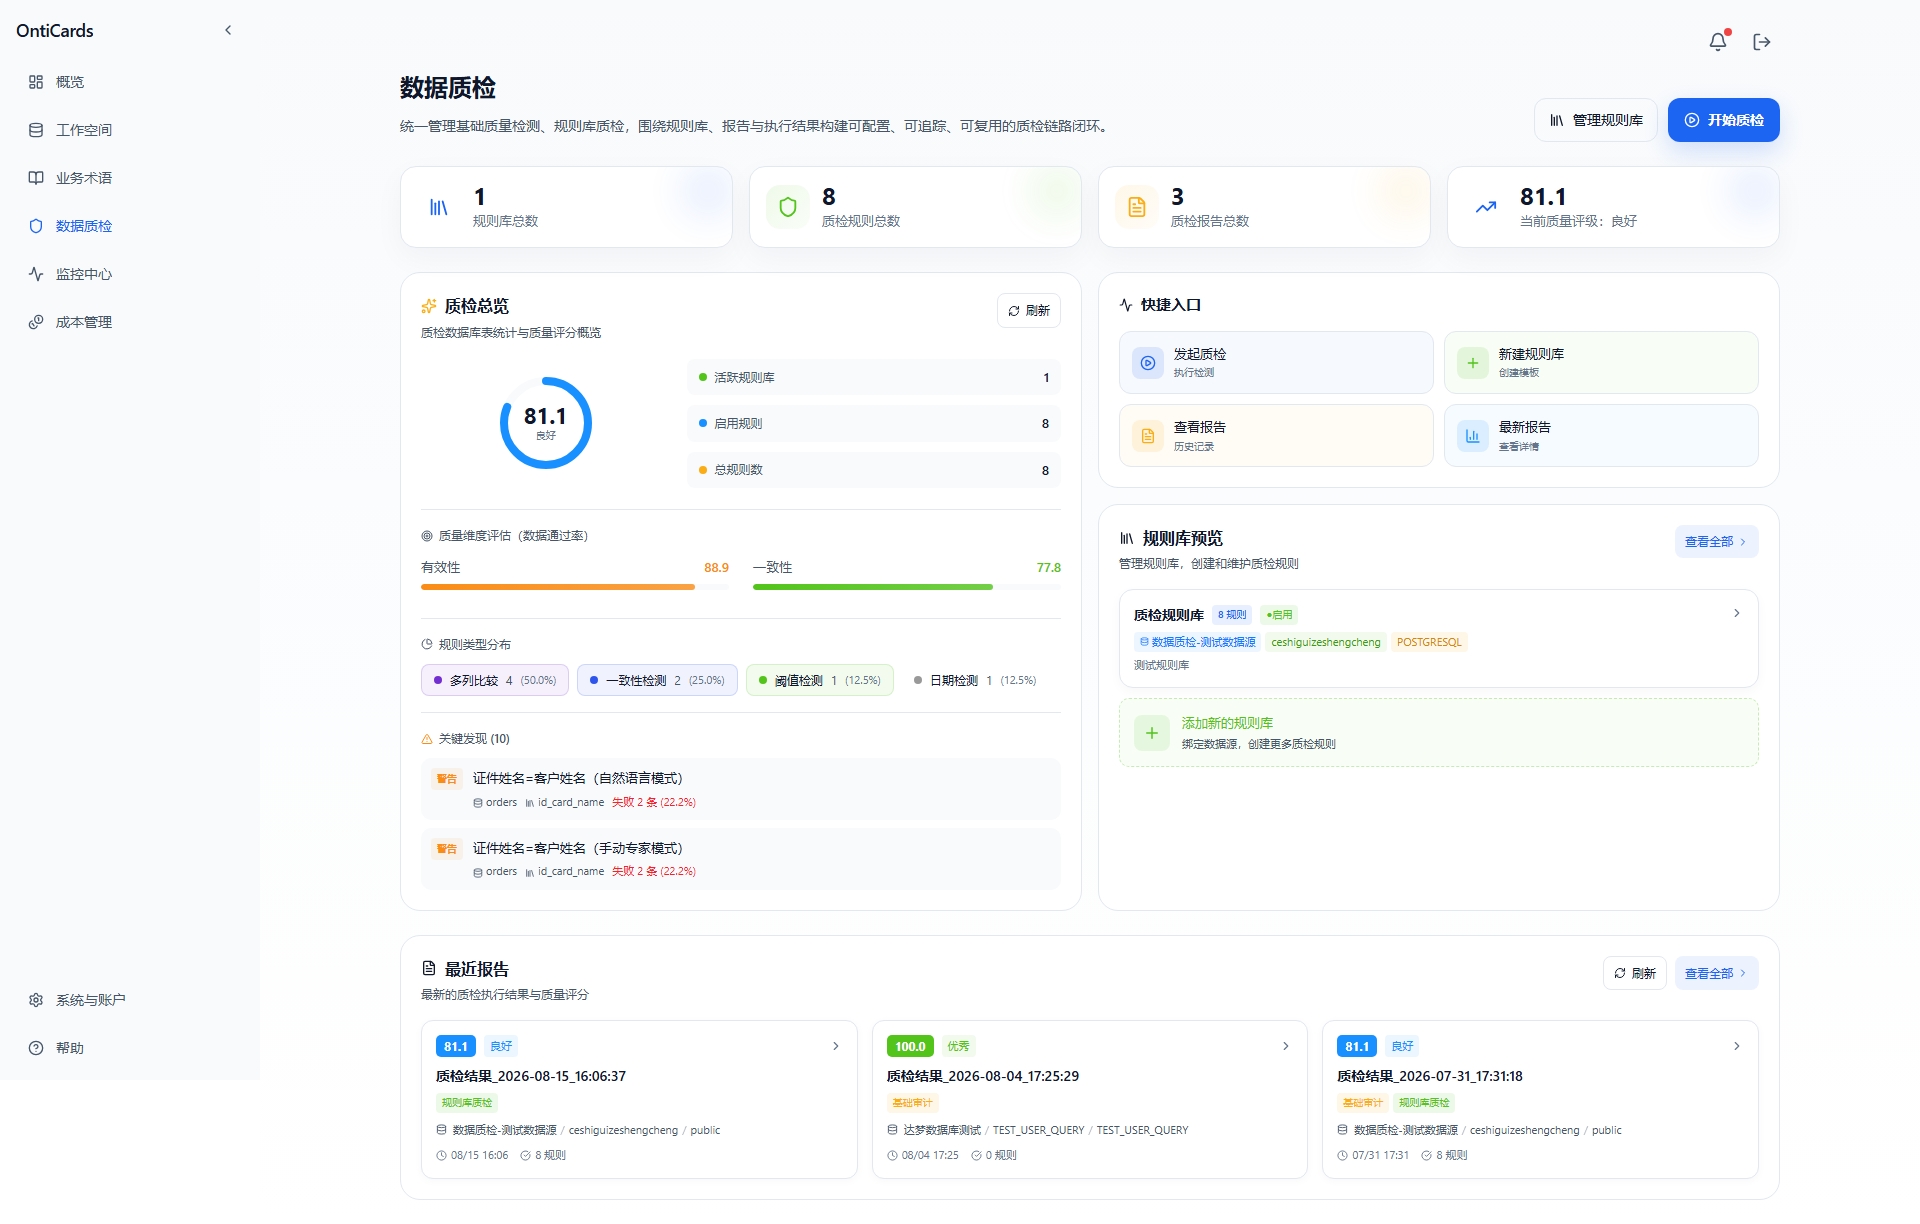
Top metric cards:
- Total rule libraries
- Number of enabled rules
- Total quality check reports
- Current quality score
Quality overview:
A donut chart shows the share of "active rules", "enabled rules", and "total rules", along with the current quality score (e.g. 81.1).
Quality dimension assessment:
Scores shown by dimension, including:
- Validity (e.g. 86.9)
- Consistency (e.g. 77.8)
Rule type distribution: multi-object checks, consistency checks, uniqueness checks, date checks, etc.
Key findings: lists the fields with the most serious issues
Quick entries:
- New rule library
- Create rule
- View reports
- Whole-database report
Recent reports: shows historical report cards; click to view details.
Rule library management page (enter via the Rule Library tab):
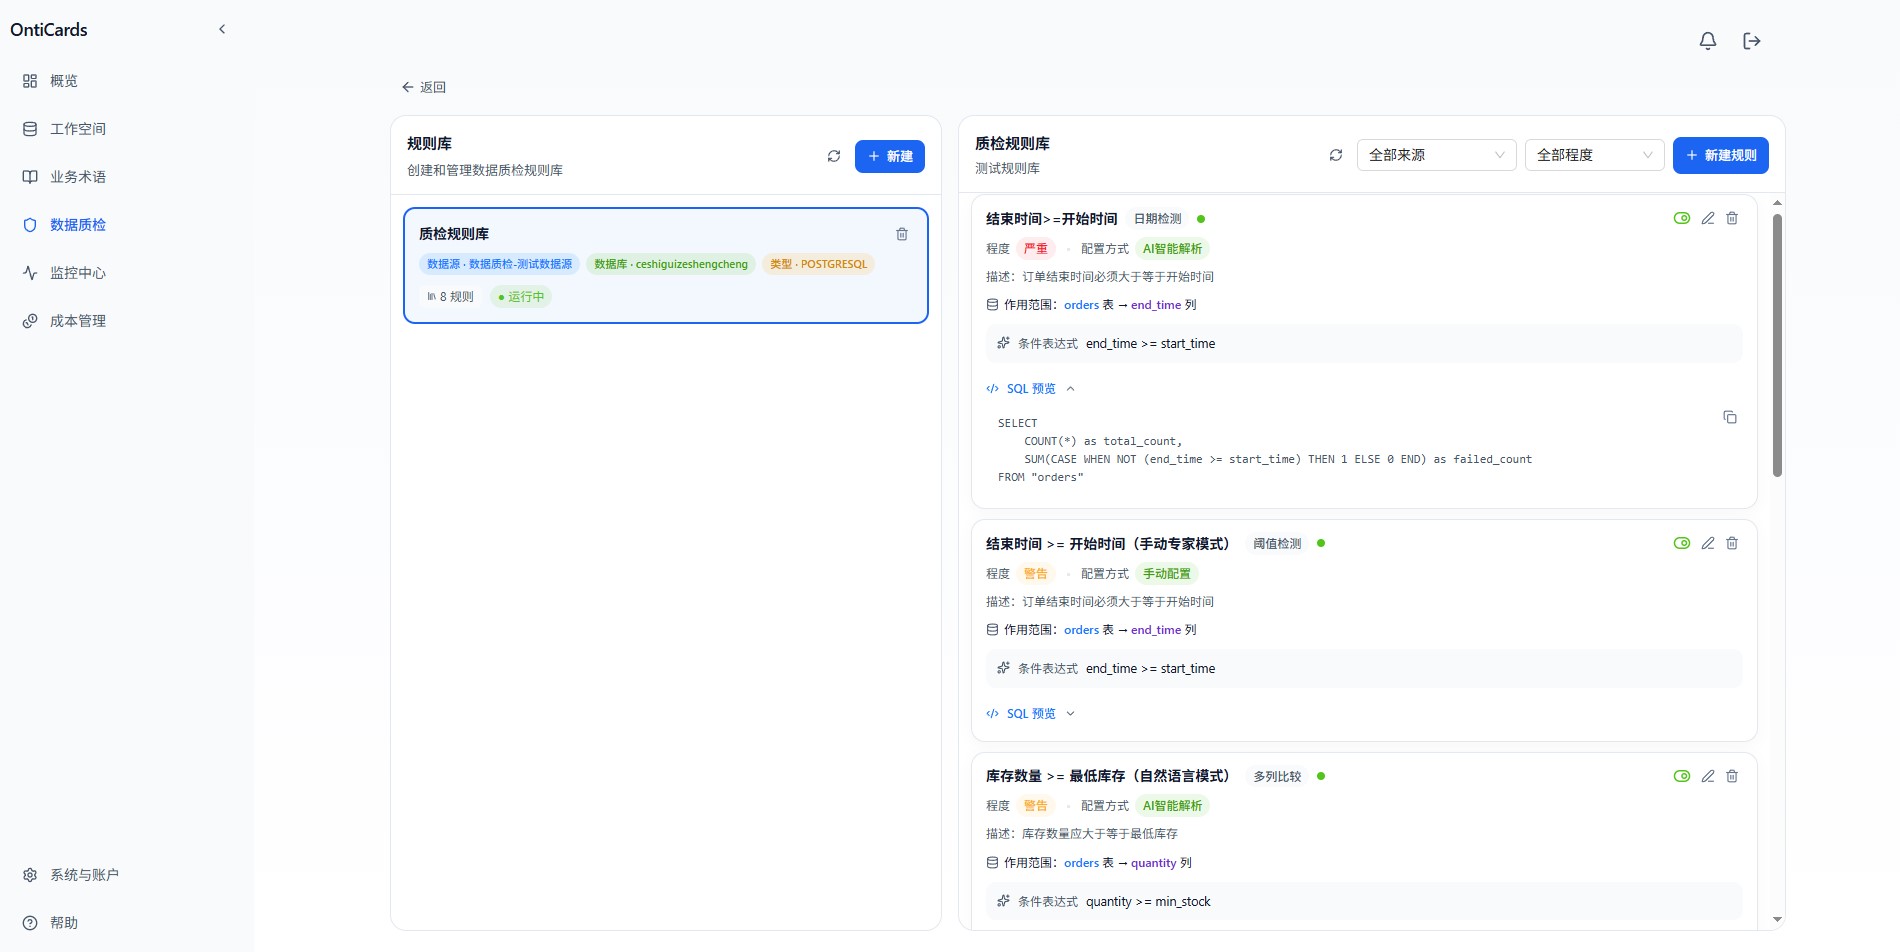
The page uses a two-column layout:
- Left "Rule library" list: shows all rule libraries (e.g. "Zhebao-Youdaoli-test data source"), with data source/Schema markers, rule counts, and run status
- Top filters: filter by "All data sources" and "All severities"
- Add Rule button: opens the rule creation dialog
- Rule list (one rule per row): shows rule name, severity (critical/warning), AI parsing, scope (schema.table + column), condition expression (with an auto-generated SQL preview), and enable/edit/delete actions
- Right "Quality check rule library" details:
💡 The same rule can be reused across multiple data sources. Rule severity can be set to critical or warning, which determines the severity of issues and the report score.
9.2 Creating Quality Check Rules
Step 1: Create a rule library
- Click New Rule Library on the Data Quality home page
- Rule library name
- The linked data source
- Fill in:
- After saving, rules can be added to the library
Step 2: Add a rule
Three creation methods are supported:
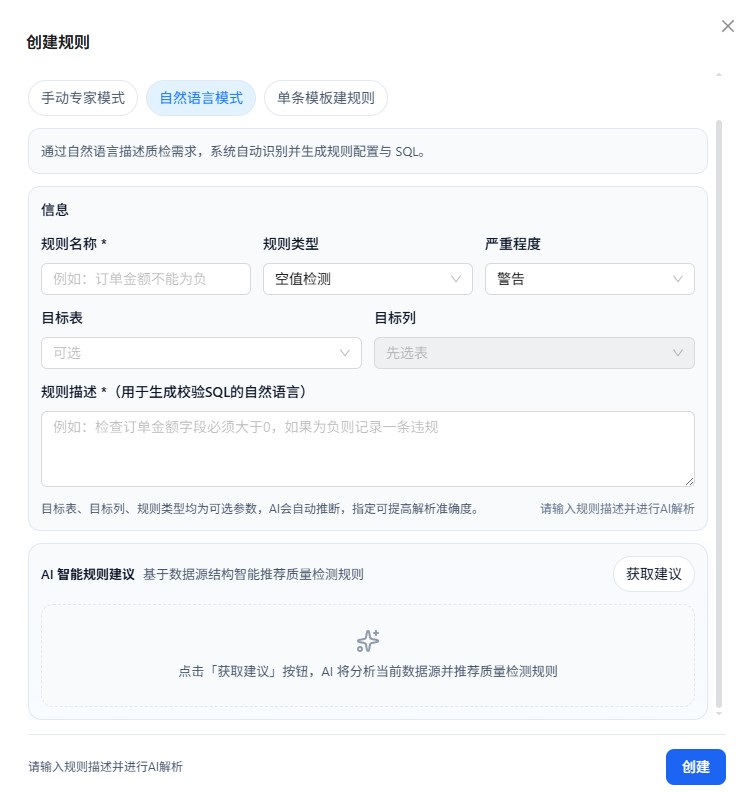
- Manual expert mode: fully hand-fill the rule name, target table/column, and SQL condition (for complex business rules)
- Natural-language mode: describe the requirement in one sentence and the AI generates the SQL and configuration automatically (recommended; lowest barrier)
- Single template rule: pick from preset templates (null check / consistency / uniqueness / range, etc.) and fill in the parameters
Method 1: Template mode
Choose from preset templates (fastest):
- Email format validation
- Phone number format validation
- ID card number validation
- Amount non-null check
- Date range check
- ...
Method 2: AI mode (recommended)
Describe the rule in natural language and the system generates the configuration:
- "Check that the order table's amount is greater than 0"
- "Check that the phone numbers in the user table have 11 digits"
- "Check that email formats are correct"
Method 3: Manual mode
Configure the rule parameters directly:
| Rule type | Use case |
|---|---|
| Non-null check | Required fields must not be empty |
| Uniqueness check | Primary key / unique index fields |
| Format validation | Email, phone number, ID card |
| Range check | Numeric / date ranges |
| Enum value check | Field values must be within a given set |
| Regex matching | Custom regular expressions |
| Cross-table comparison | Foreign key reference consistency |
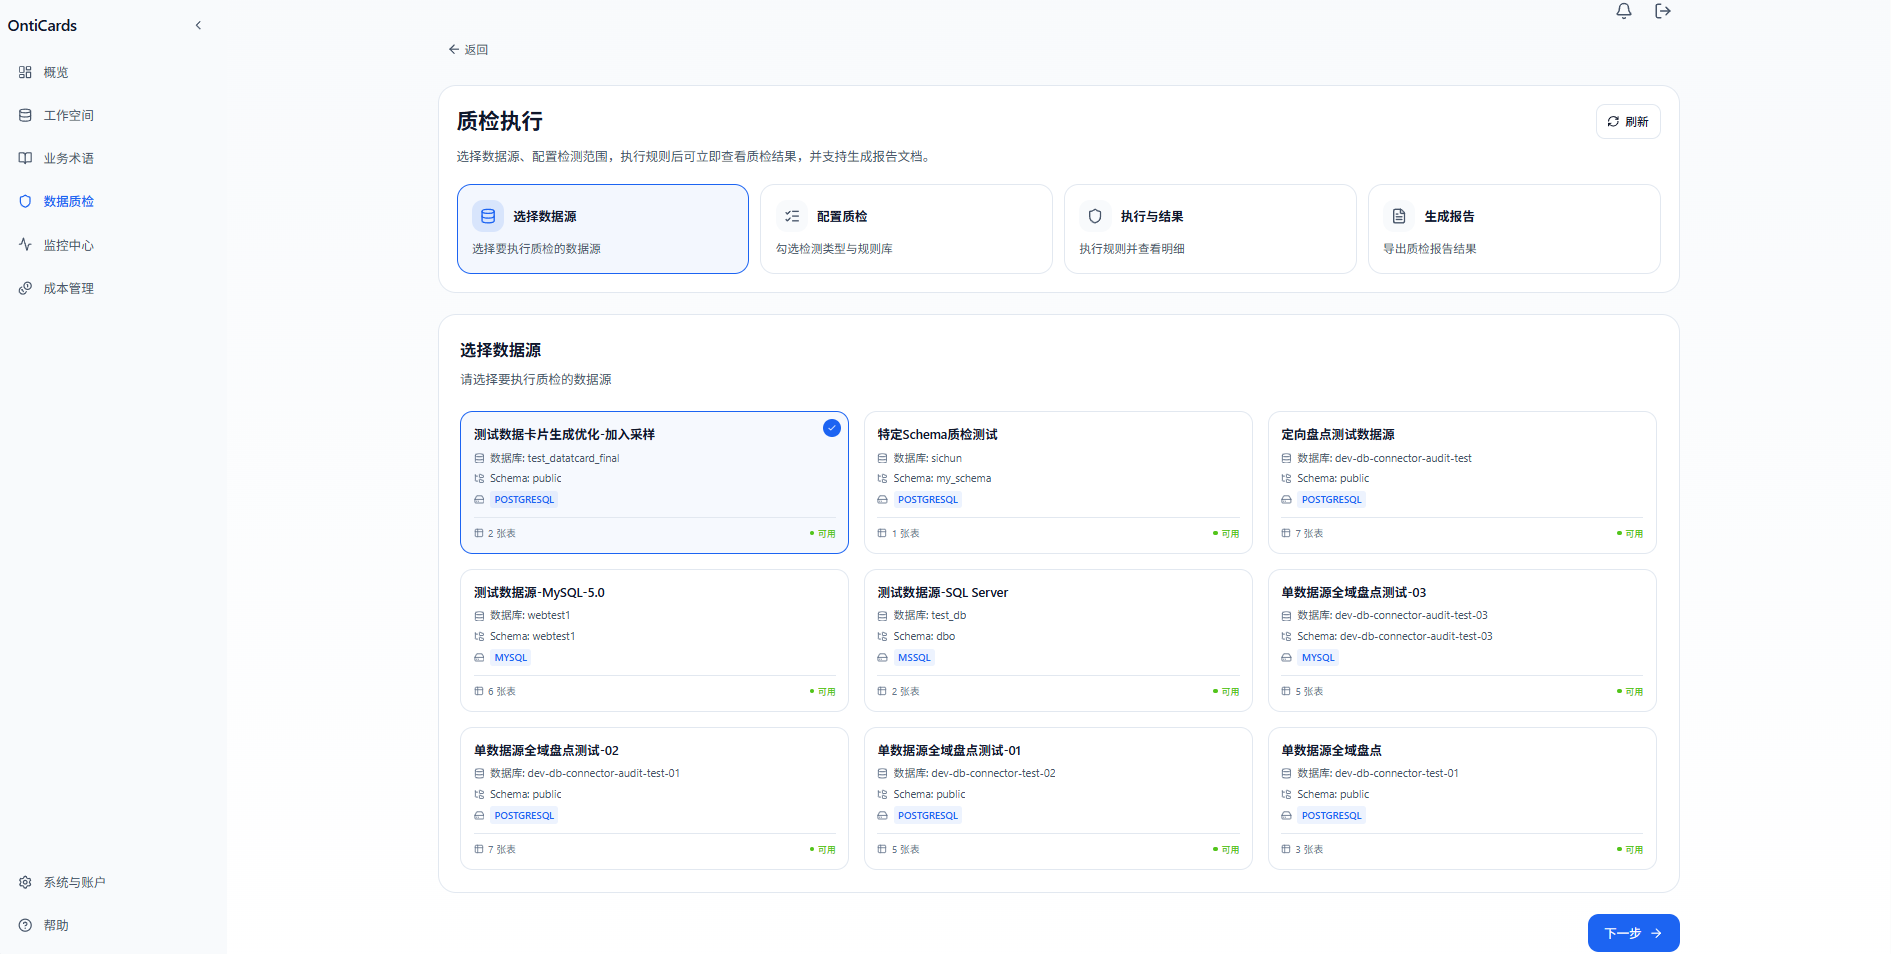
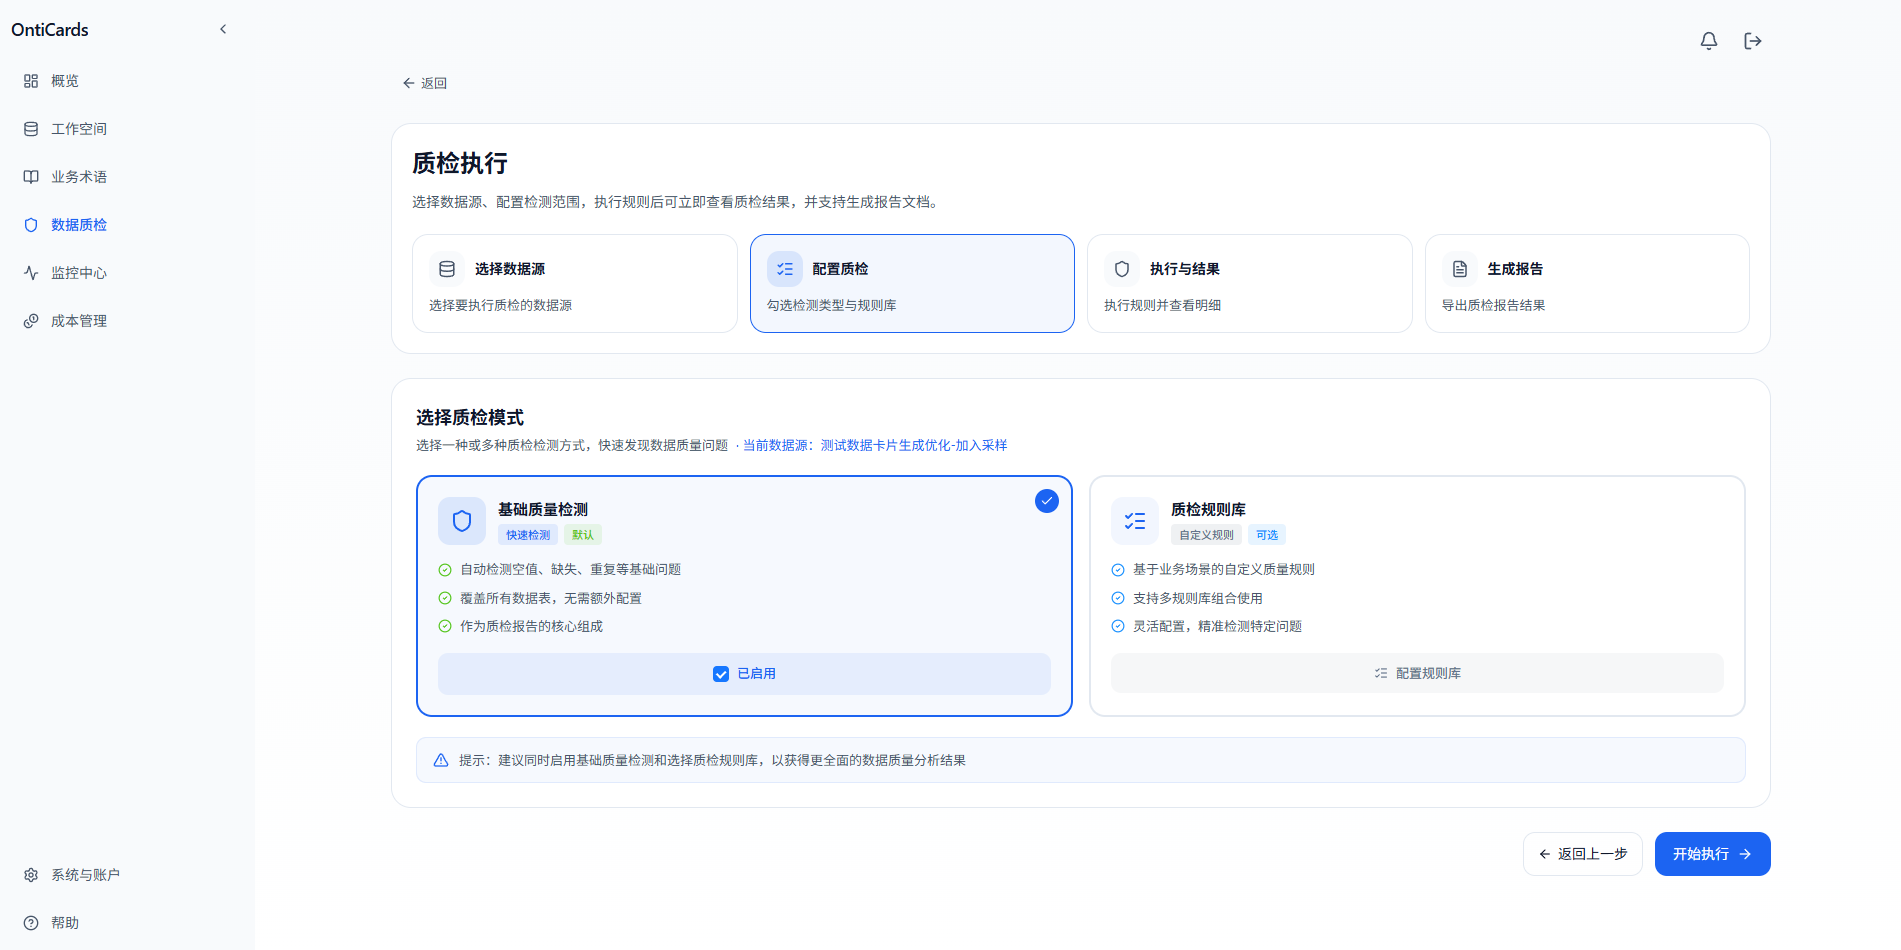
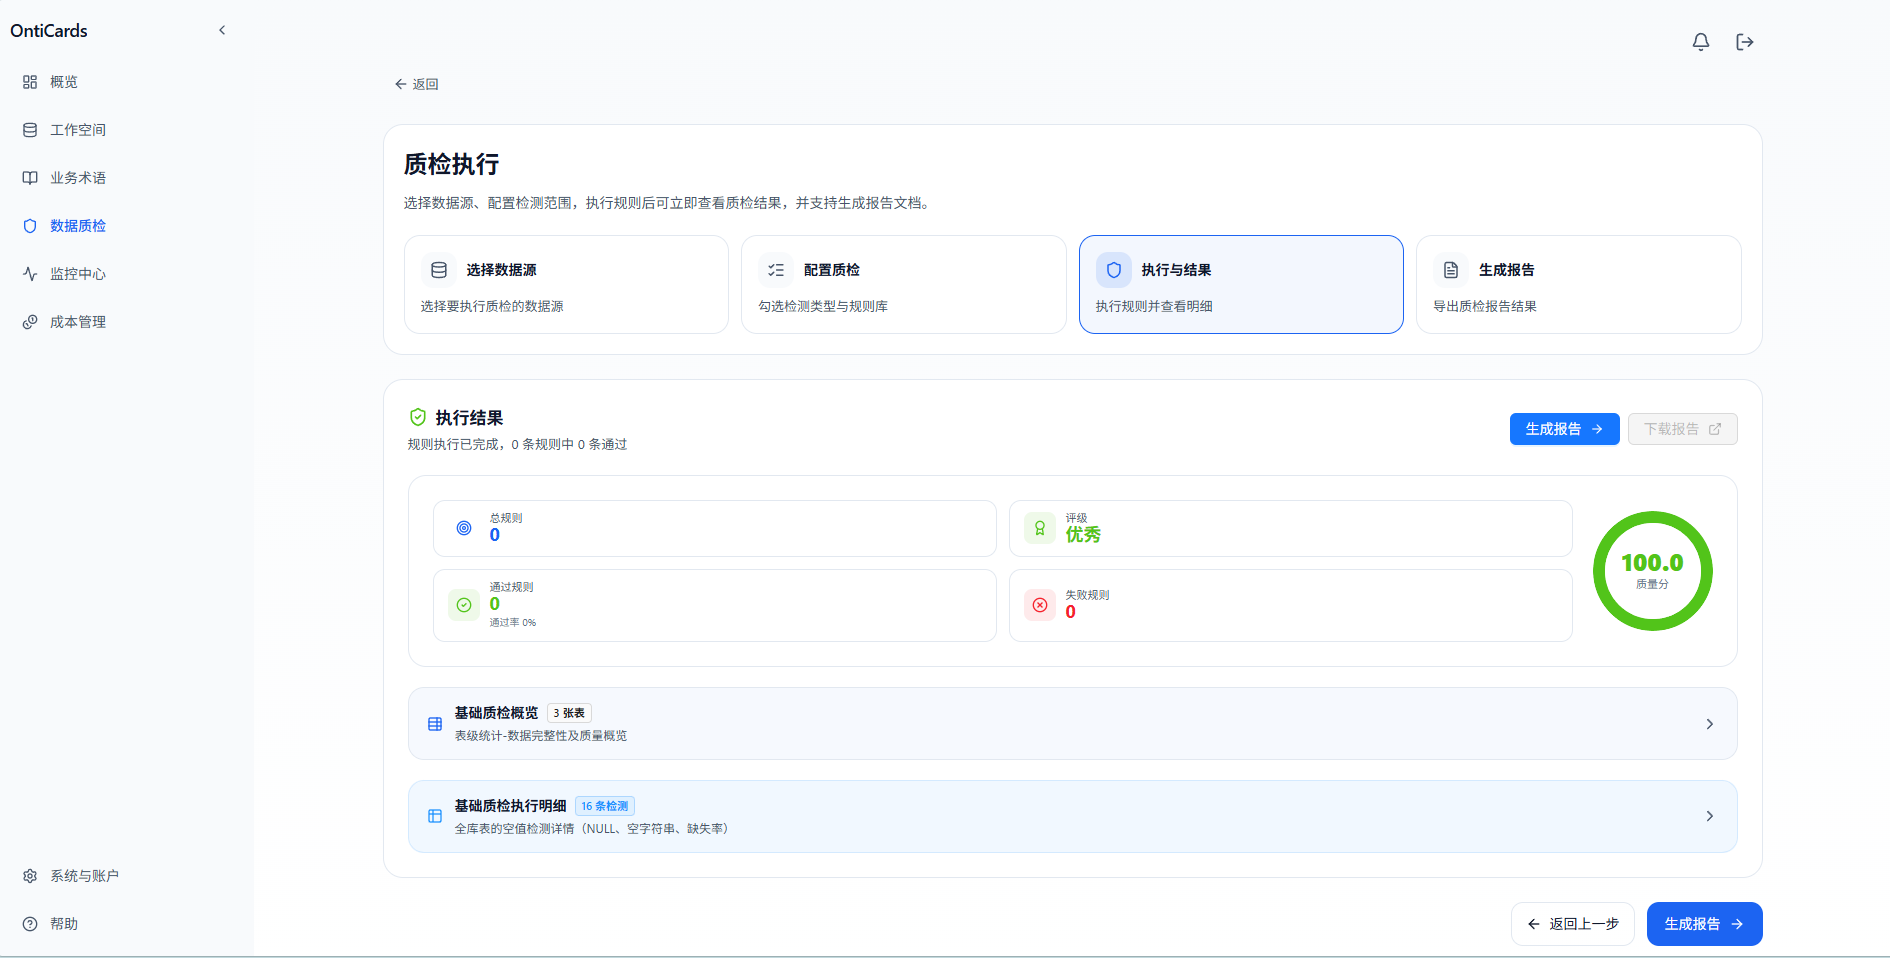
9.3 Running Quality Checks
- Go to Data Quality for the data source, or the top-level Data Quality page
- Select a rule library or specific rules
- Click Start Execution
- Wait for execution to complete (duration varies with data volume)
- Review the details on the execution results page
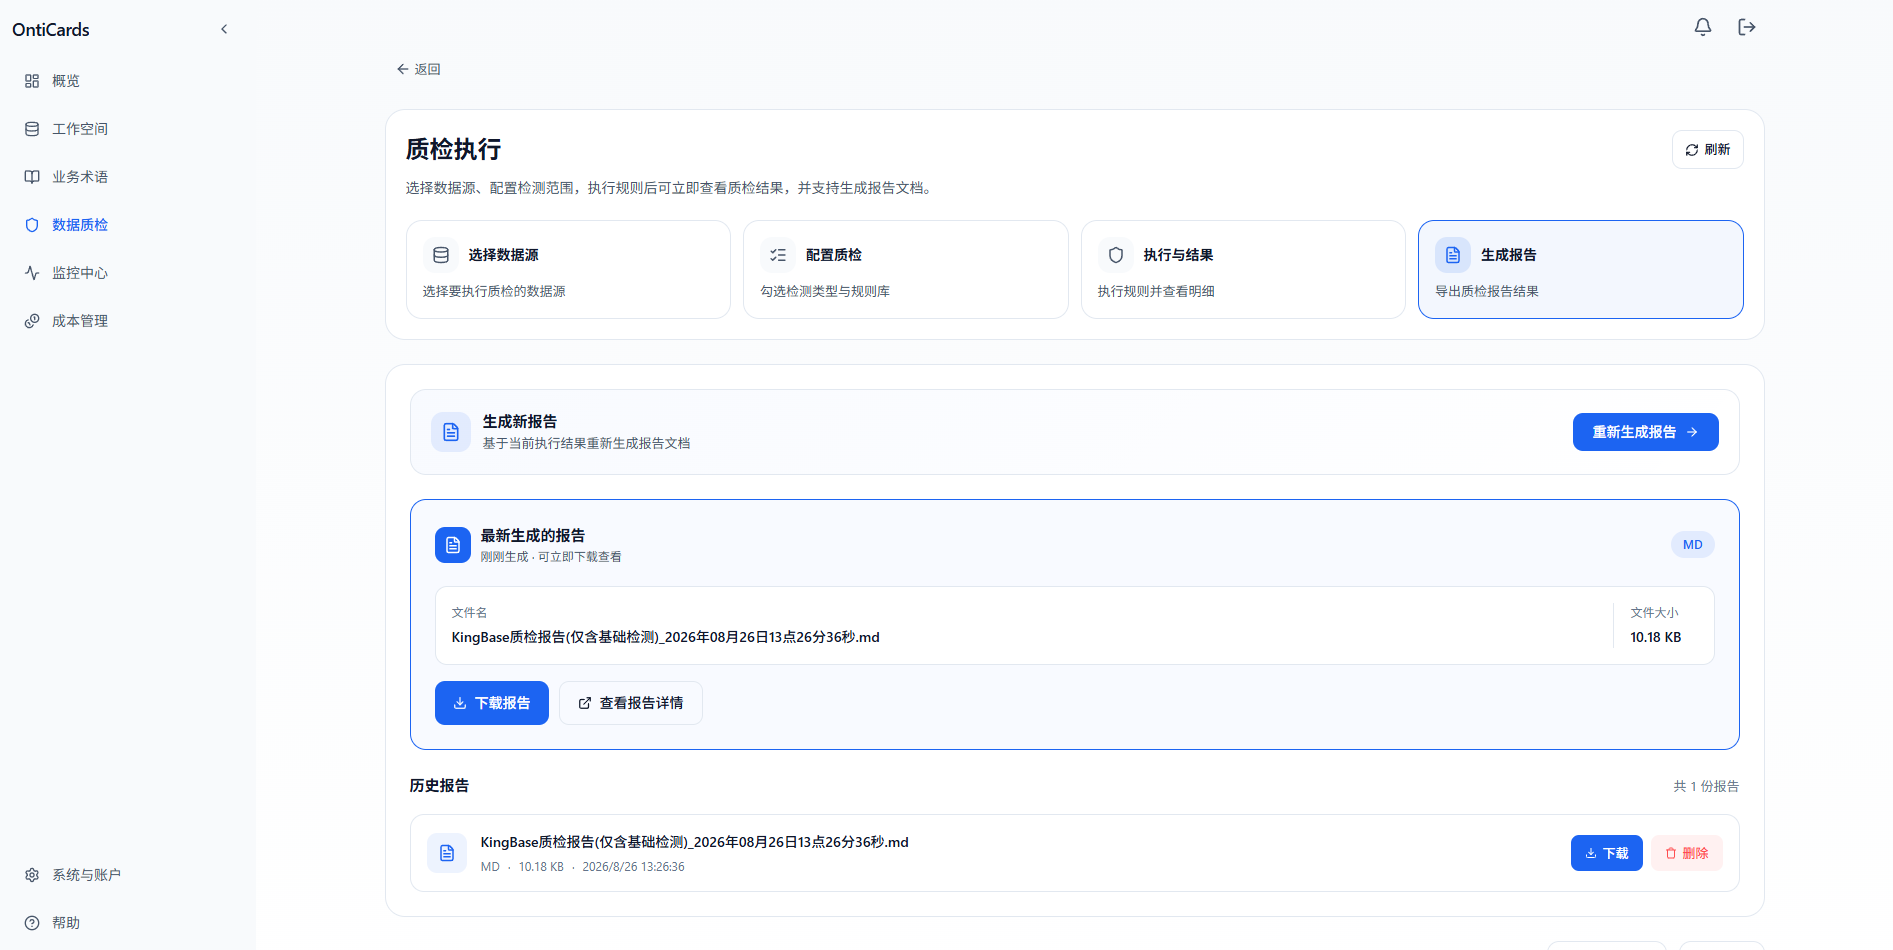
- Download the quality report file
9.4 Quality Scores
| Grade | Score range | Description | | -- | ------- | ------- | | Excellent | ≥ 95 | Data quality is very good | | Good | 85 - 95 | Data quality is good | | Fair | 70 - 85 | Room for improvement | | Poor | 60 - 70 | Quite a few issues | | Bad | < 60 | Serious issues |
The score is a weighted calculation based on pass rate, average issue count, and issue severity.
9.5 Quality Check Reports
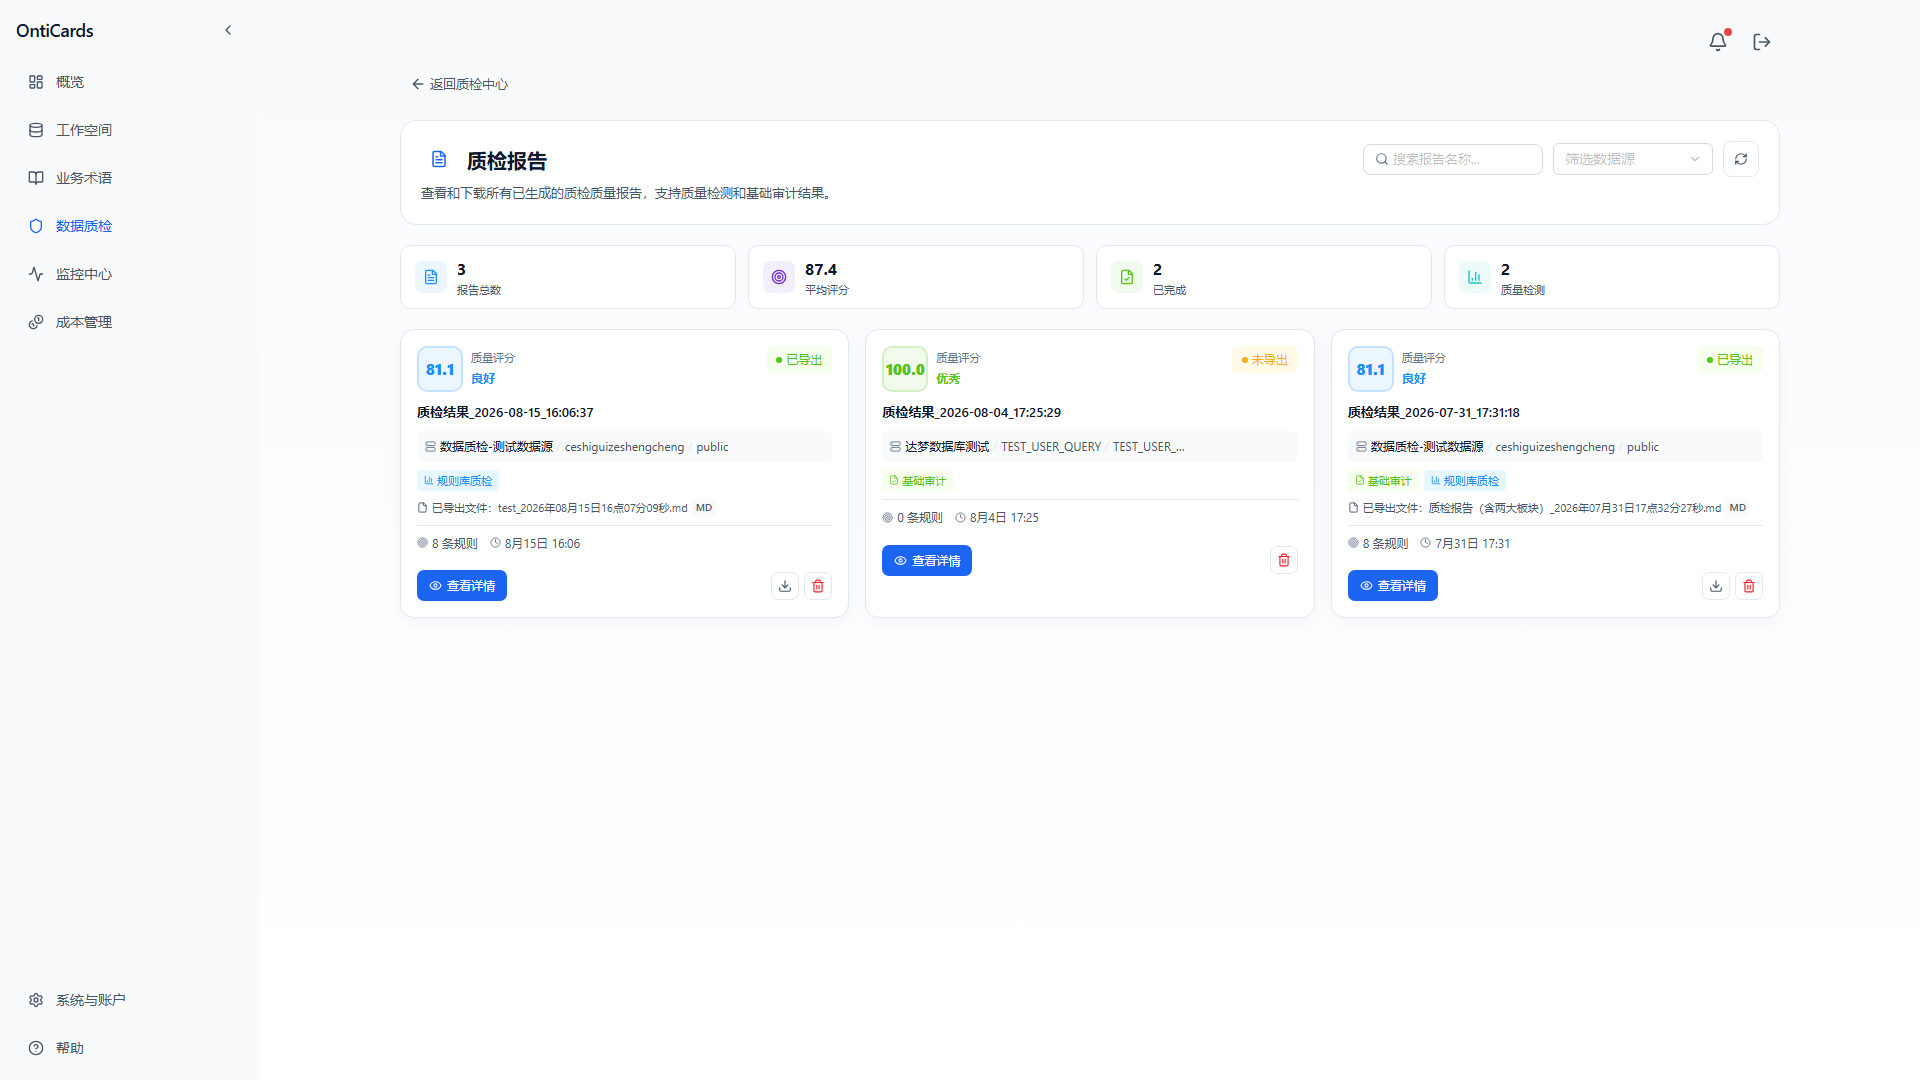
The report list page shows all historical reports as cards; each card displays:
- Report ID
- Quality check target (data source, schema)
- Average score
- Exported / not exported status
- Checked / total tables
- Start / end time
- Action buttons: view details, download, delete
Report details include:
- Score breakdown by dimension
- Health score of every table
- Check results of every rule (passed/failed/error counts)
- Failed samples (first N records)
Single report details page:
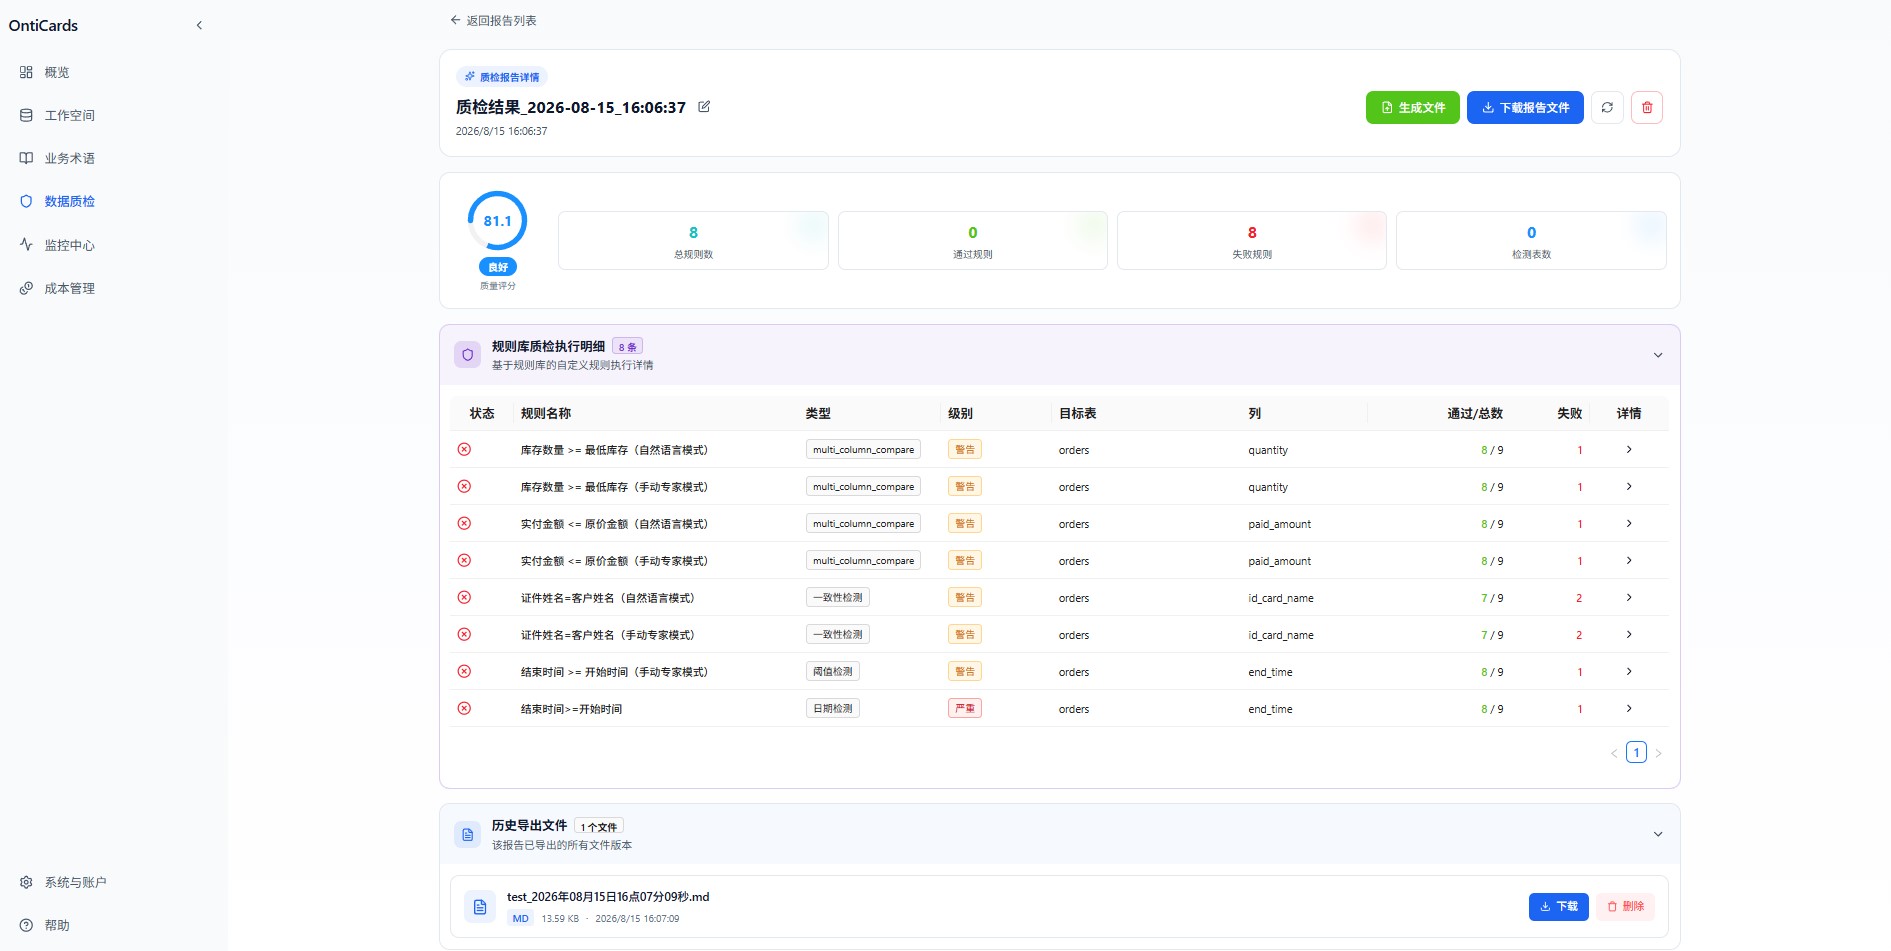
After entering a single report you can see:
- Report header: quality score, generation time, plus 4 global actions — "Generate file", "Download report file", "Refresh", "Delete"
- Quality score card (top left): a donut progress chart showing the grade "Good (81.1)", with total rules (8), passed (0), failed (8), and checked tables (0)
- Rule library execution details: one row per rule, with status, rule name, type, severity (warning/critical), target table/column, passed/total, failed count, and a details entry
- Historical exported files: the bottom of the report keeps previous downloads for re-downloading or deletion
Rule execution details (expand via "Details"):
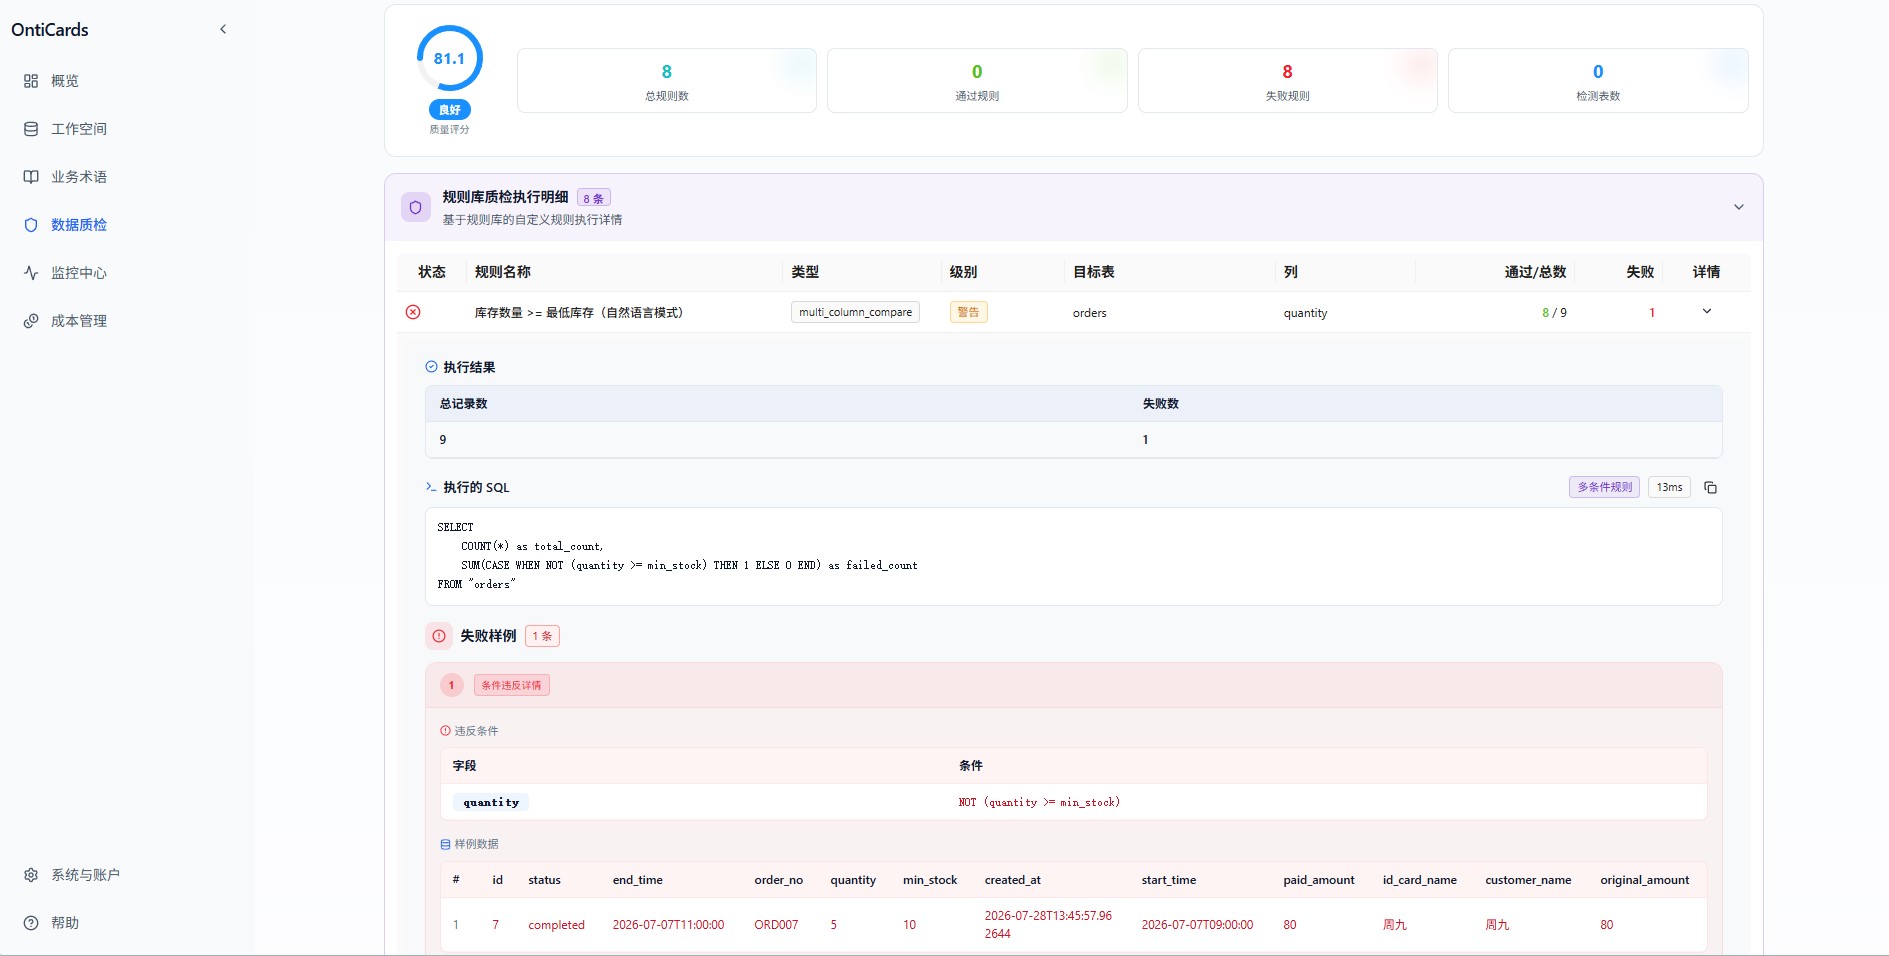
The execution details of a single rule show 3 main blocks:
| Block | Content |
|---|---|
| Execution result | Total records, failed count (pie chart) |
| Executed SQL | One-click copy or regenerate; duration shown on the right (e.g. 13ms) |
| Failed samples | Matching condition + field (quantity whether the expression quantity >= min_stock holds) + sample data (up to N rows, including full field values) |
Downloading the report file (generate by clicking "Download report file"):
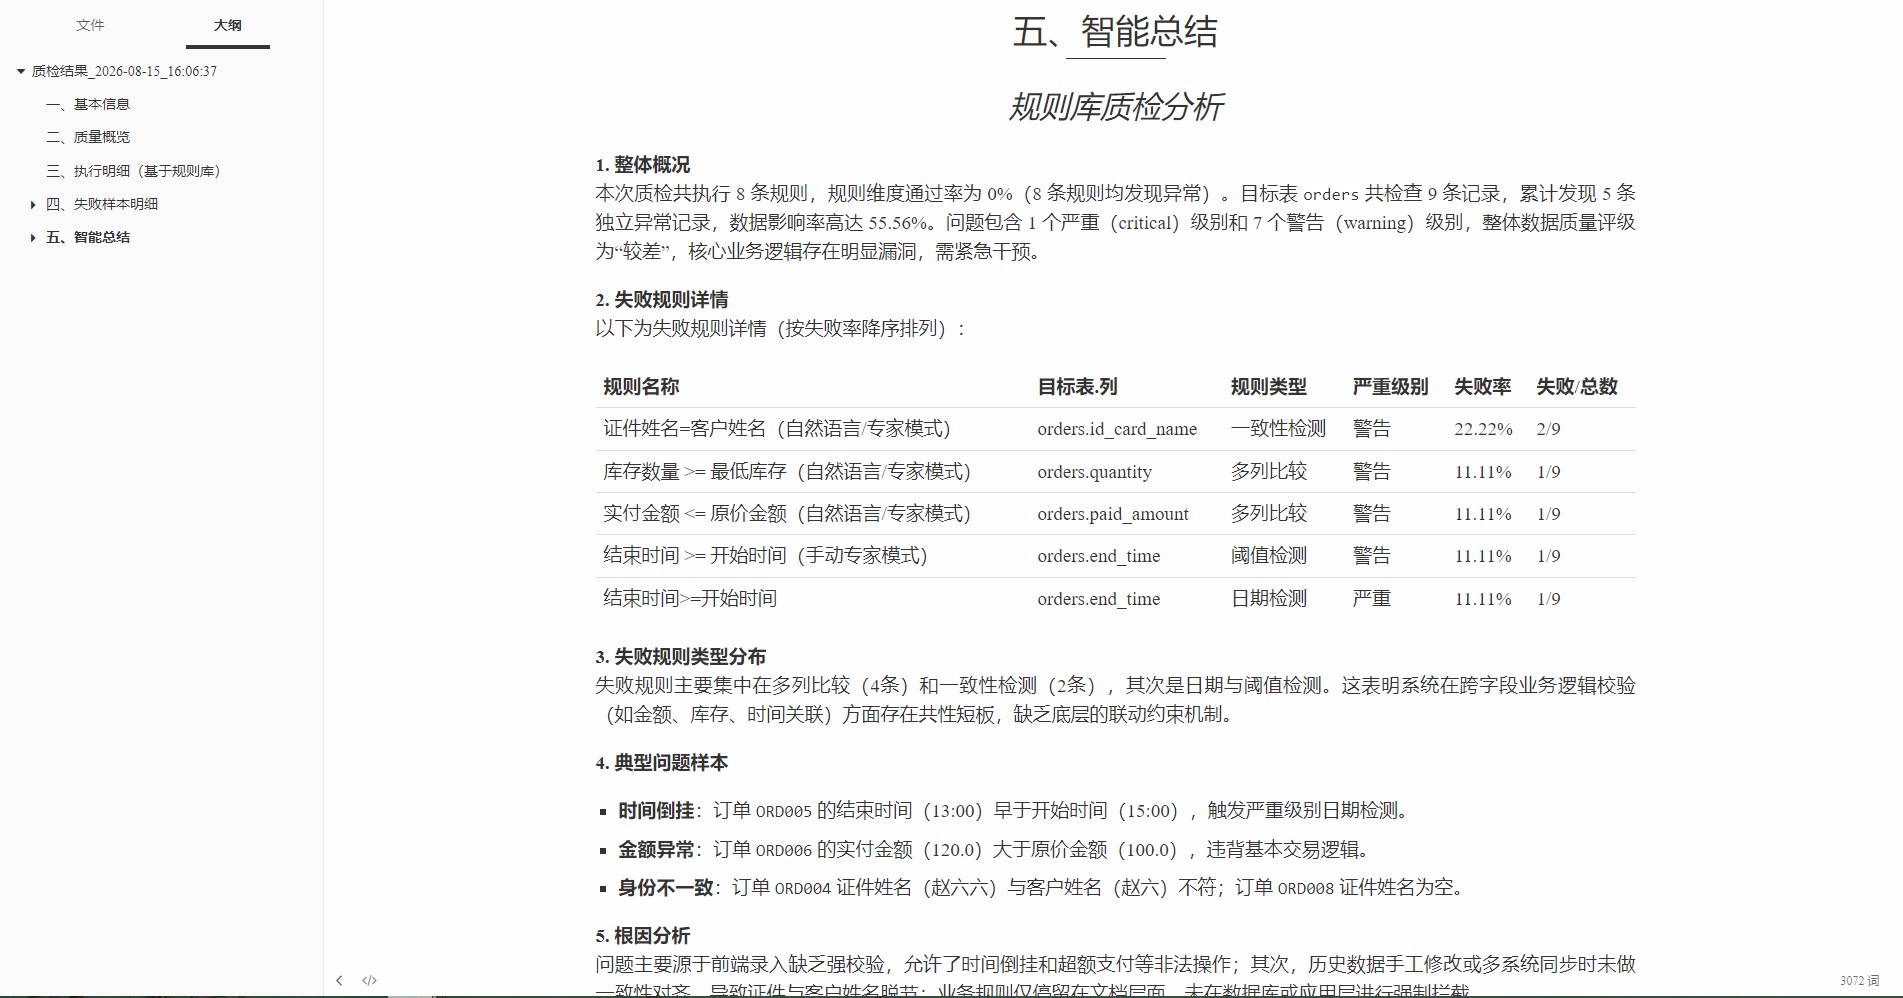
The downloaded report is in Markdown format, organized into 5 sections:
- Basic information — report ID / target data source / time range
- Quality overview — overall score, pass rate, issue count
- Execution details (by rule library) — failure status of each rule
- Failed sample details — the specific rows hit
- Smart summary — AI automatically analyzes the failed rule details (sorted by failure rate), failed rule type distribution, typical issue samples (e.g. time inversion, abnormal amounts, inconsistent identity), and root cause analysis (e.g. lack of strong validation on front-end entry, historical data manually modified without consistency checks)
10. Monitoring Center
The Monitoring Center is the observability dashboard of the system, offering comprehensive system runtime monitoring, data analytics, and performance monitoring across key metrics such as query volume, success rate, Token consumption, latency, and data source health.
10.1 Monitoring Overview
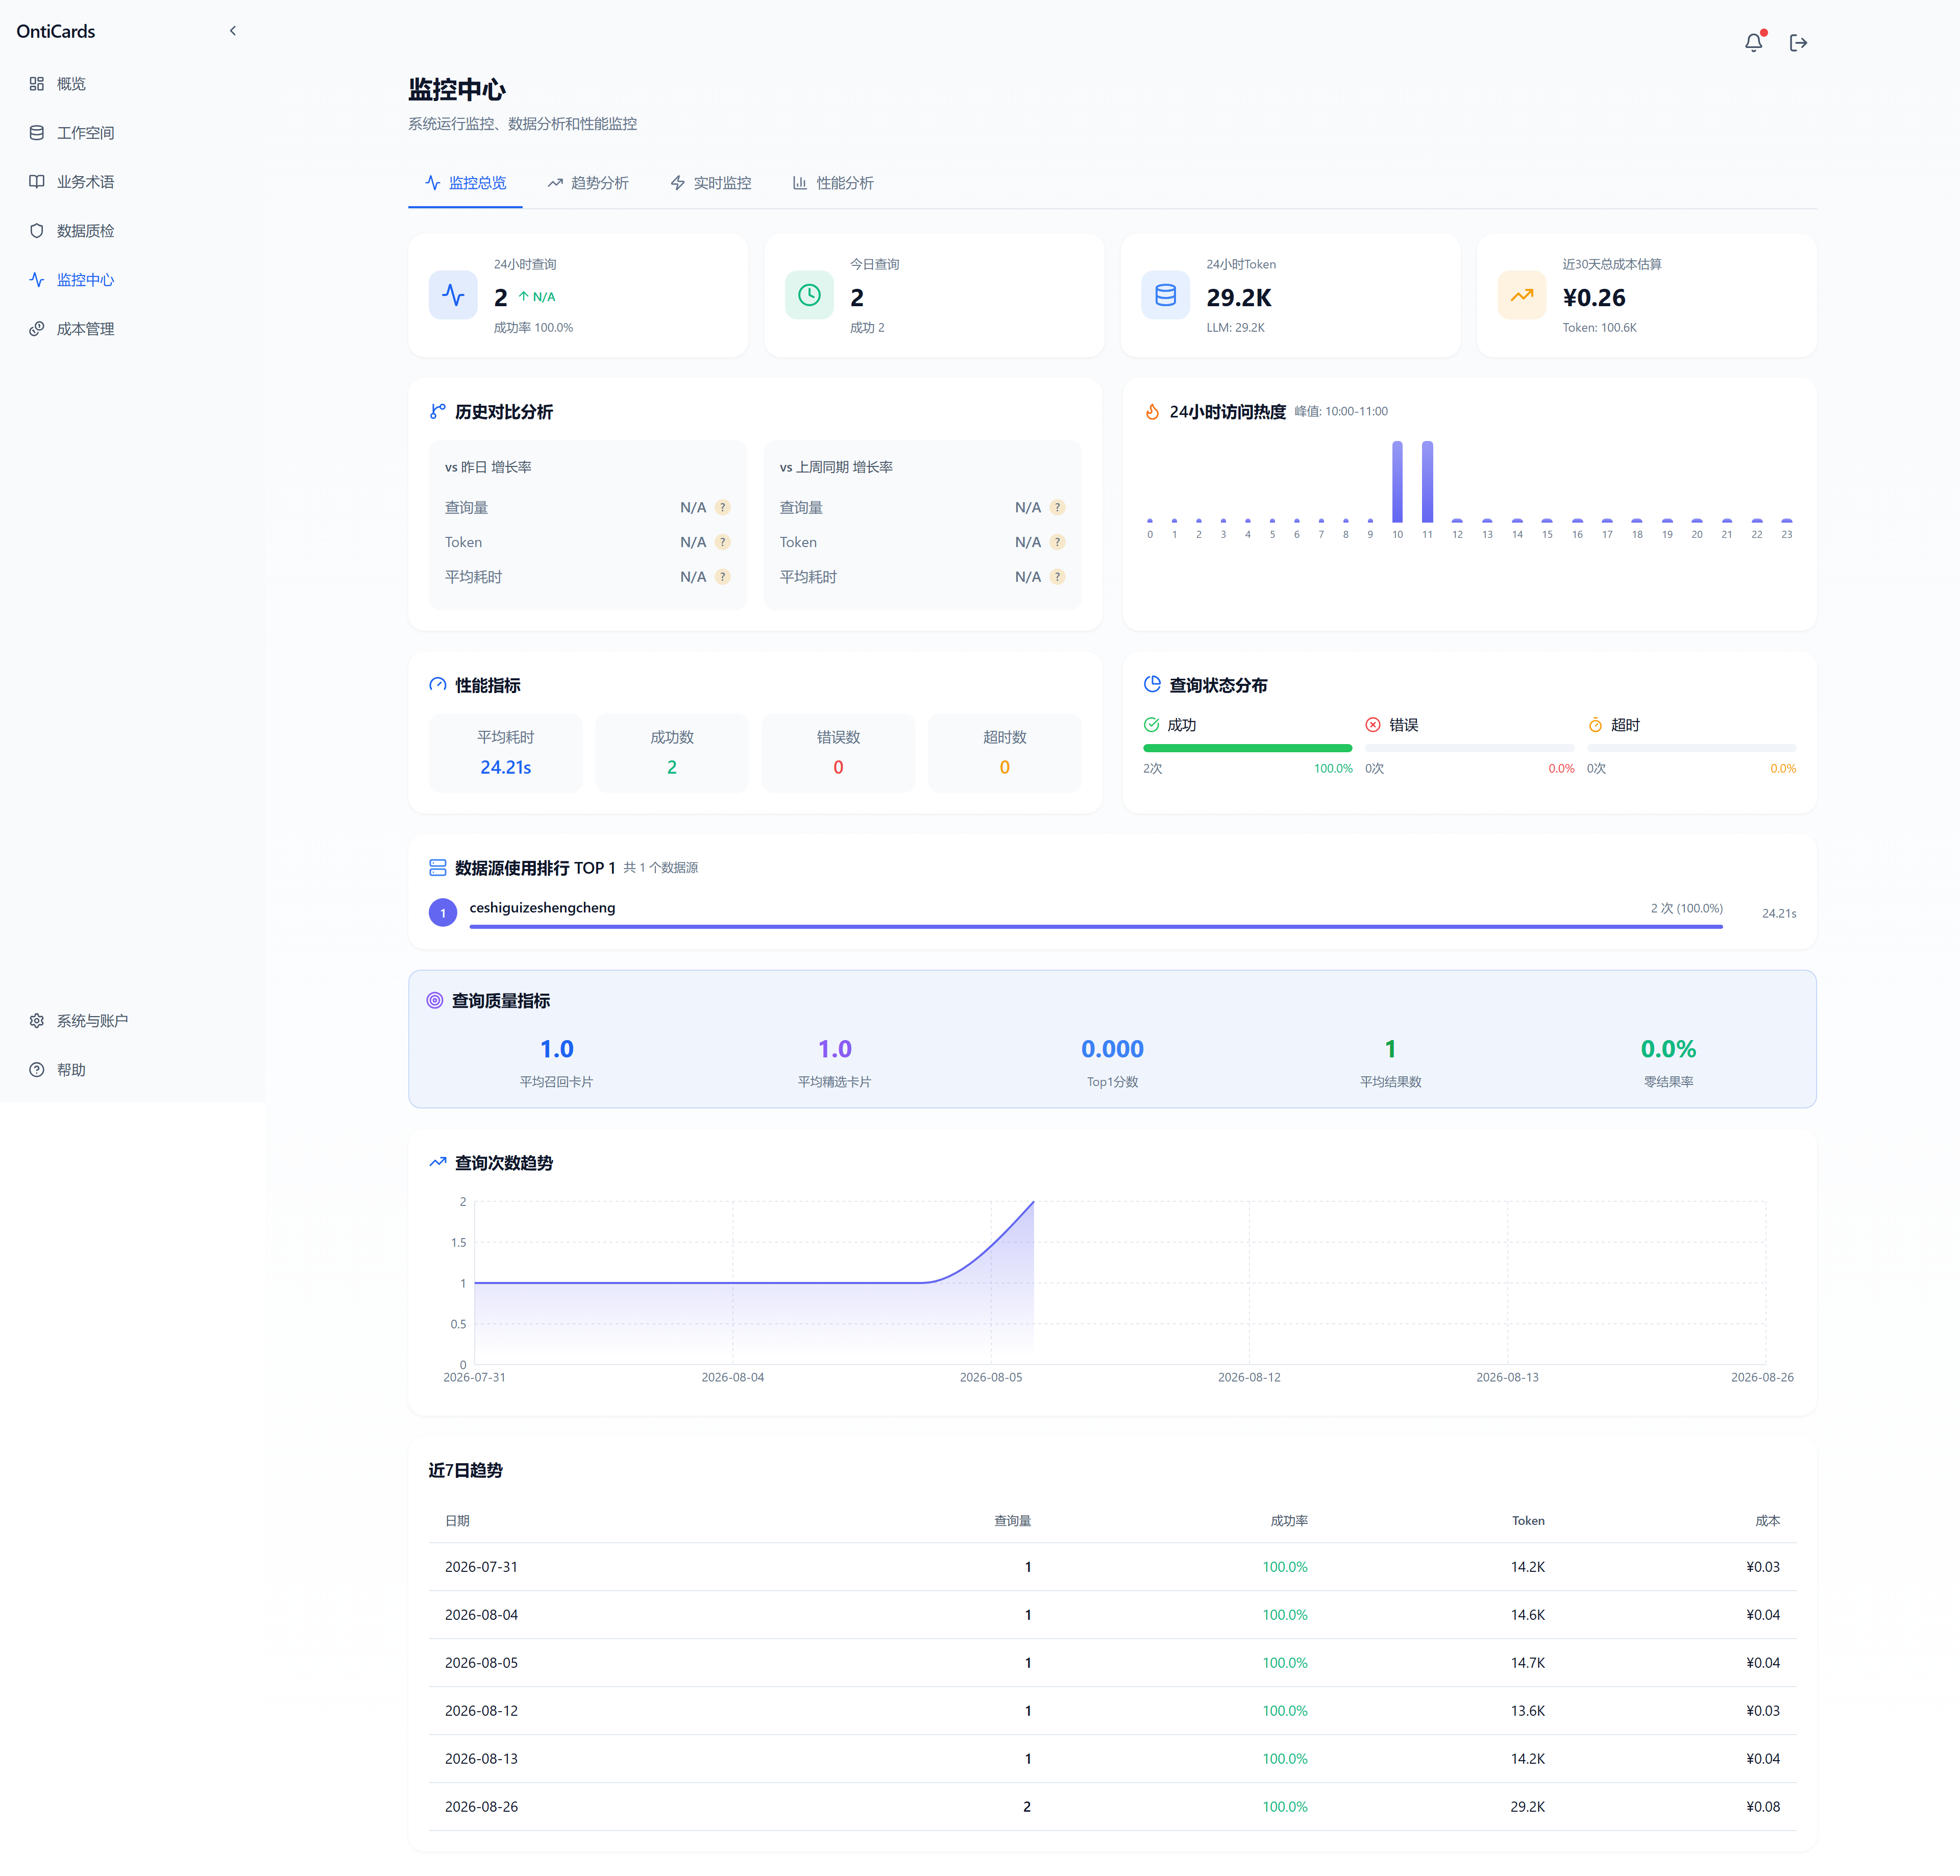
Top metric cards (last 24 hours):
| Metric | Description |
|---|---|
| Total queries | Cumulative query count for the day and the period-over-period change |
| Today's queries | Query count from midnight to now |
| 24h Token | Token consumed in the last 24 hours |
| Cost in the last 30 days | Converted into an amount (CNY) |
Historical comparison:
- Today vs. yesterday: query count, Token, average duration
- This week vs. last week: query count, Token, average duration
24-hour access heat:
A line chart showing the query volume distribution from 0-23 o'clock.
Performance metrics:
- Average duration
- Success count
- Error count
- Timeout count
Query status distribution:
A three-color ratio of success / error / timeout.
Query quality metrics:
- Average returned cards
- Average candidate cards
- Top10 score
- Average result count
- Zero-result rate
Query count trend: a bar chart of daily query volume
Last 7 days trend table:
| Date | Queries | Success rate | Token | Cost |
|---|---|---|---|---|
| 2026-08-13 | 1 | 100% | 14.2K | ¥0.04 |
| ... | ... | ... | ... | ... |
10.2 Trend Analysis
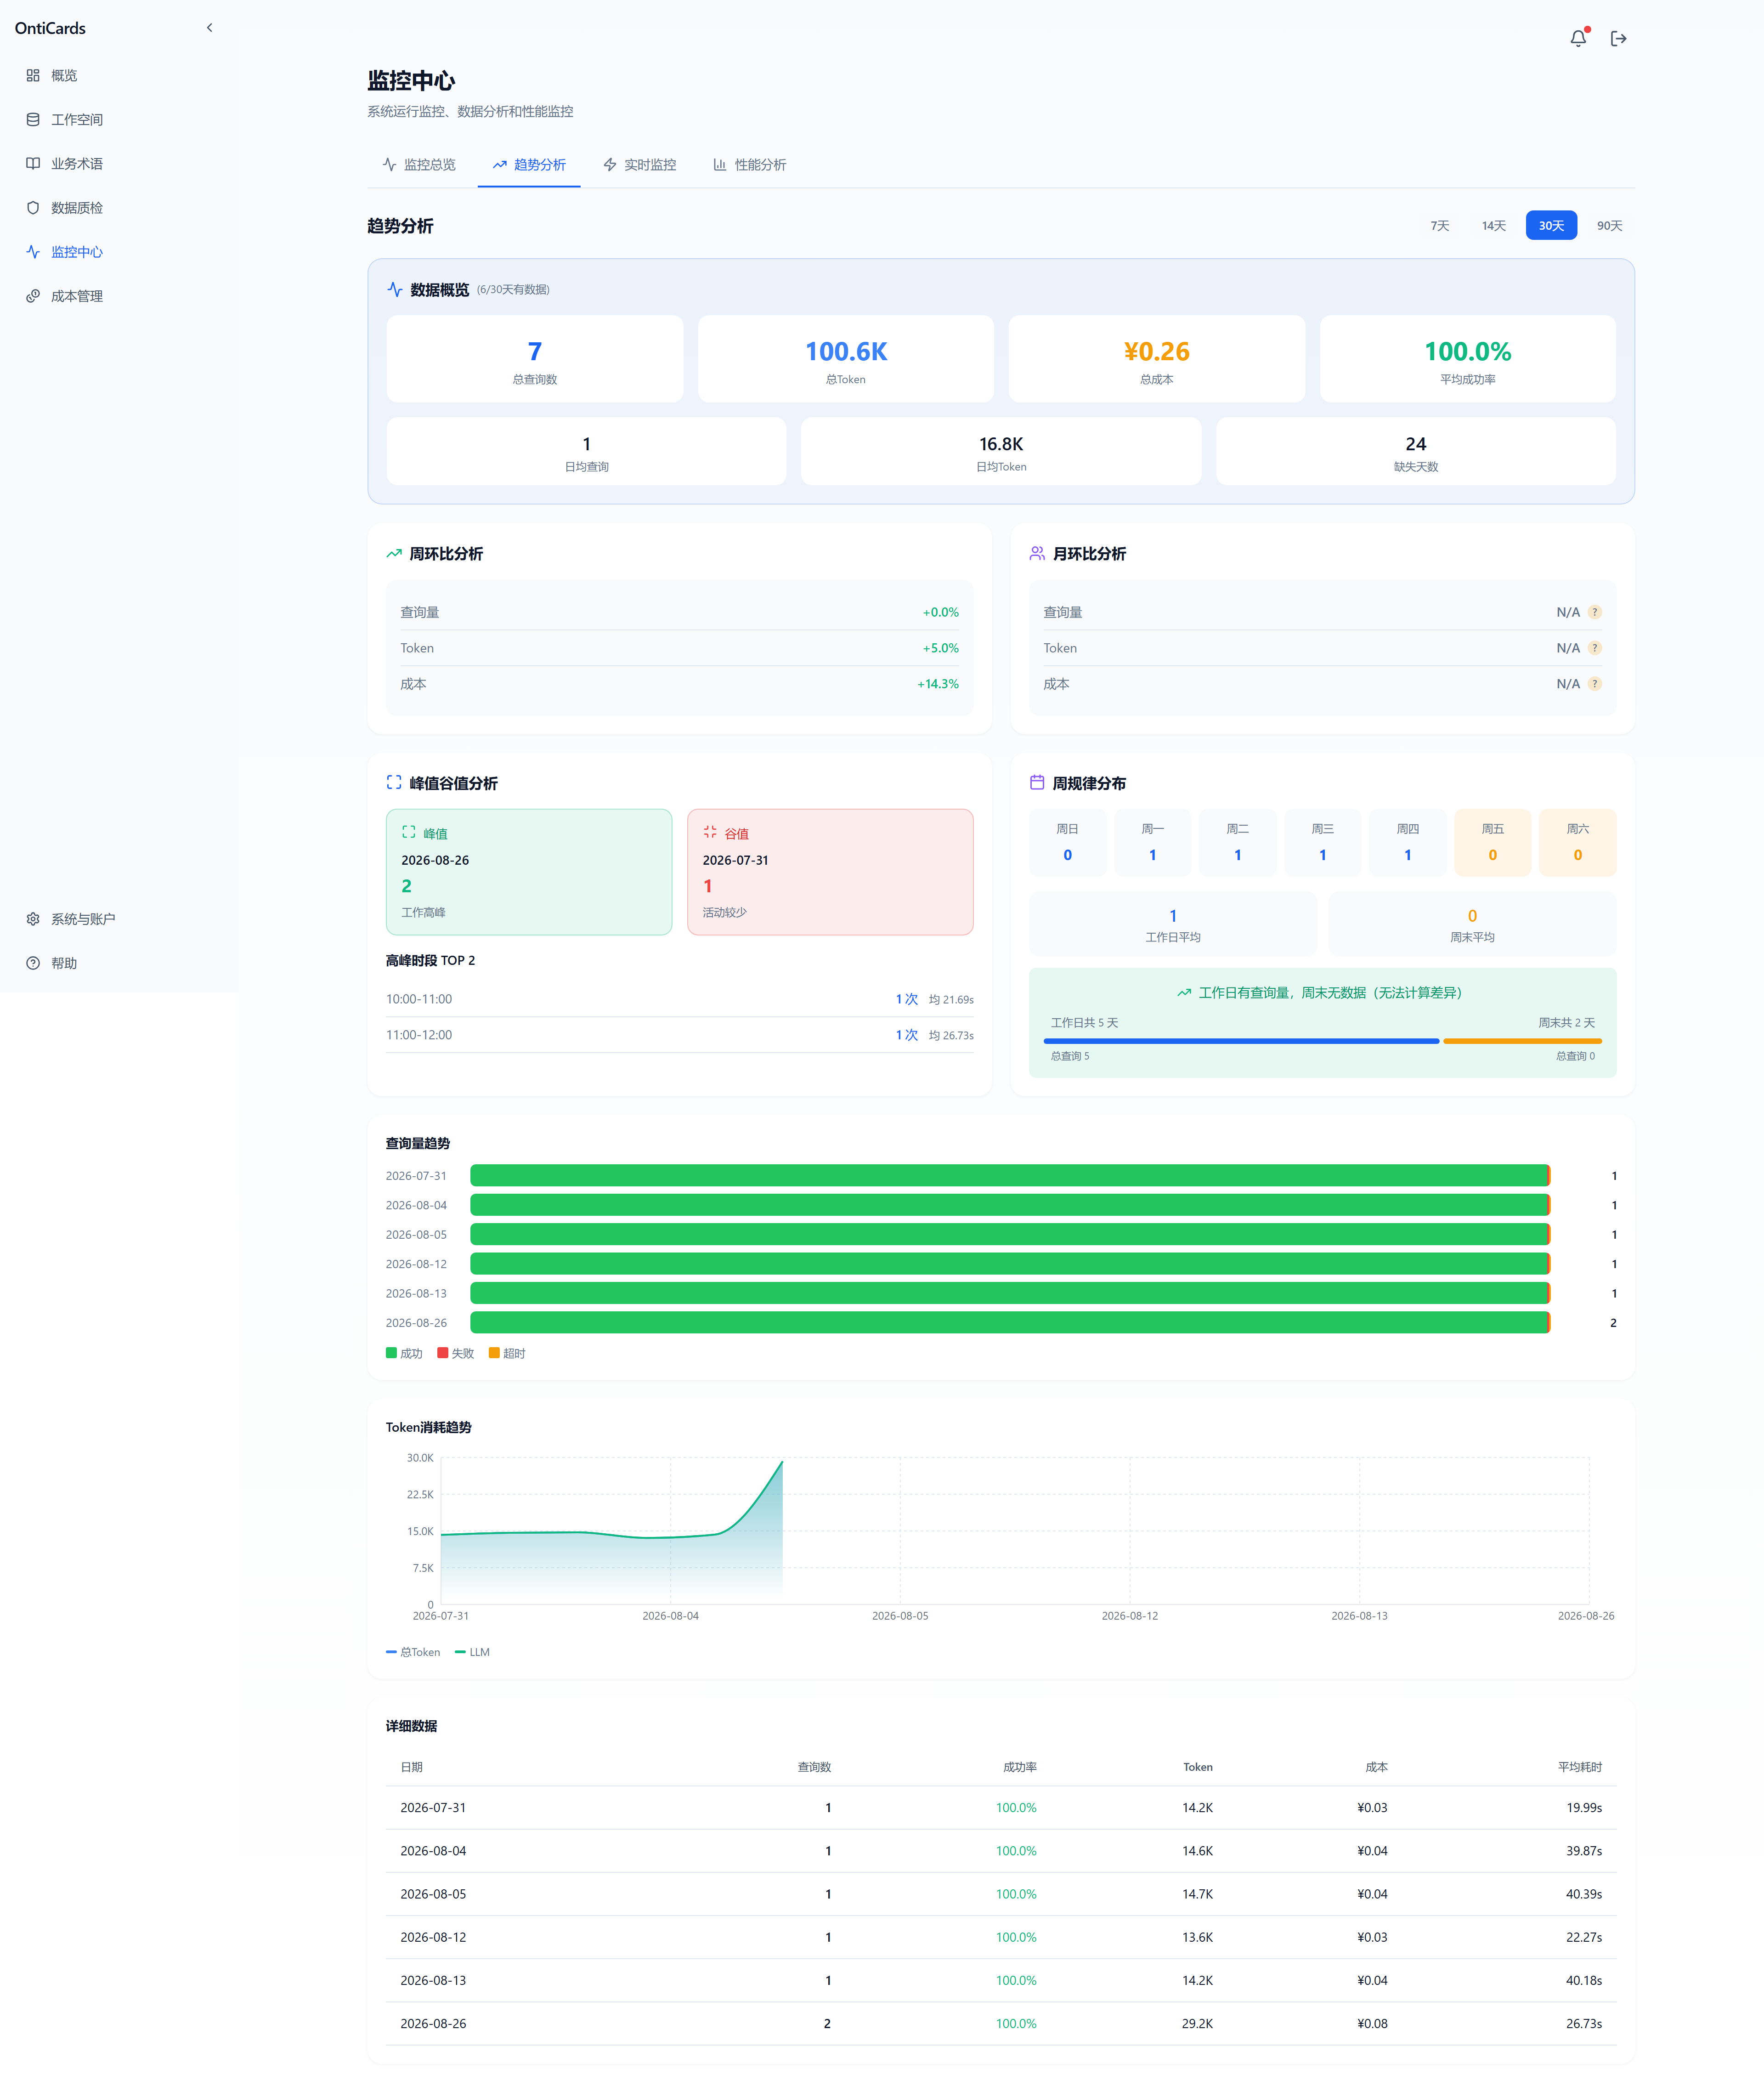
- Switch between time ranges (7 days / 14 days / 30 days)
- Top data overview (6 cards): total queries, total Token, total cost, average success rate, daily average queries, daily average Token, missing days
- Week over week: queries, Token, cost vs. last week
- Month over month: queries, Token, cost vs. last month
- Period-over-period analysis:
- Peak/valley analysis: automatically identifies the days with the highest/lowest query volume in the period and the corresponding weekdays
- Weekday/weekend distribution: daily query volume Monday-Sunday, compared against the weekday average and weekend
- Top 2 peak hours: the hour slots with the peak query volume (e.g. 10:00-11:00 / 11:00-12:00)
- Query volume trend: stacked bar chart (success / failure / timeout)
- Token consumption trend: dual-line chart (Embedding / LLM)
- Detailed data table: date, query count, success rate, Token, cost, average duration; supports CSV download
10.3 Real-Time Monitoring
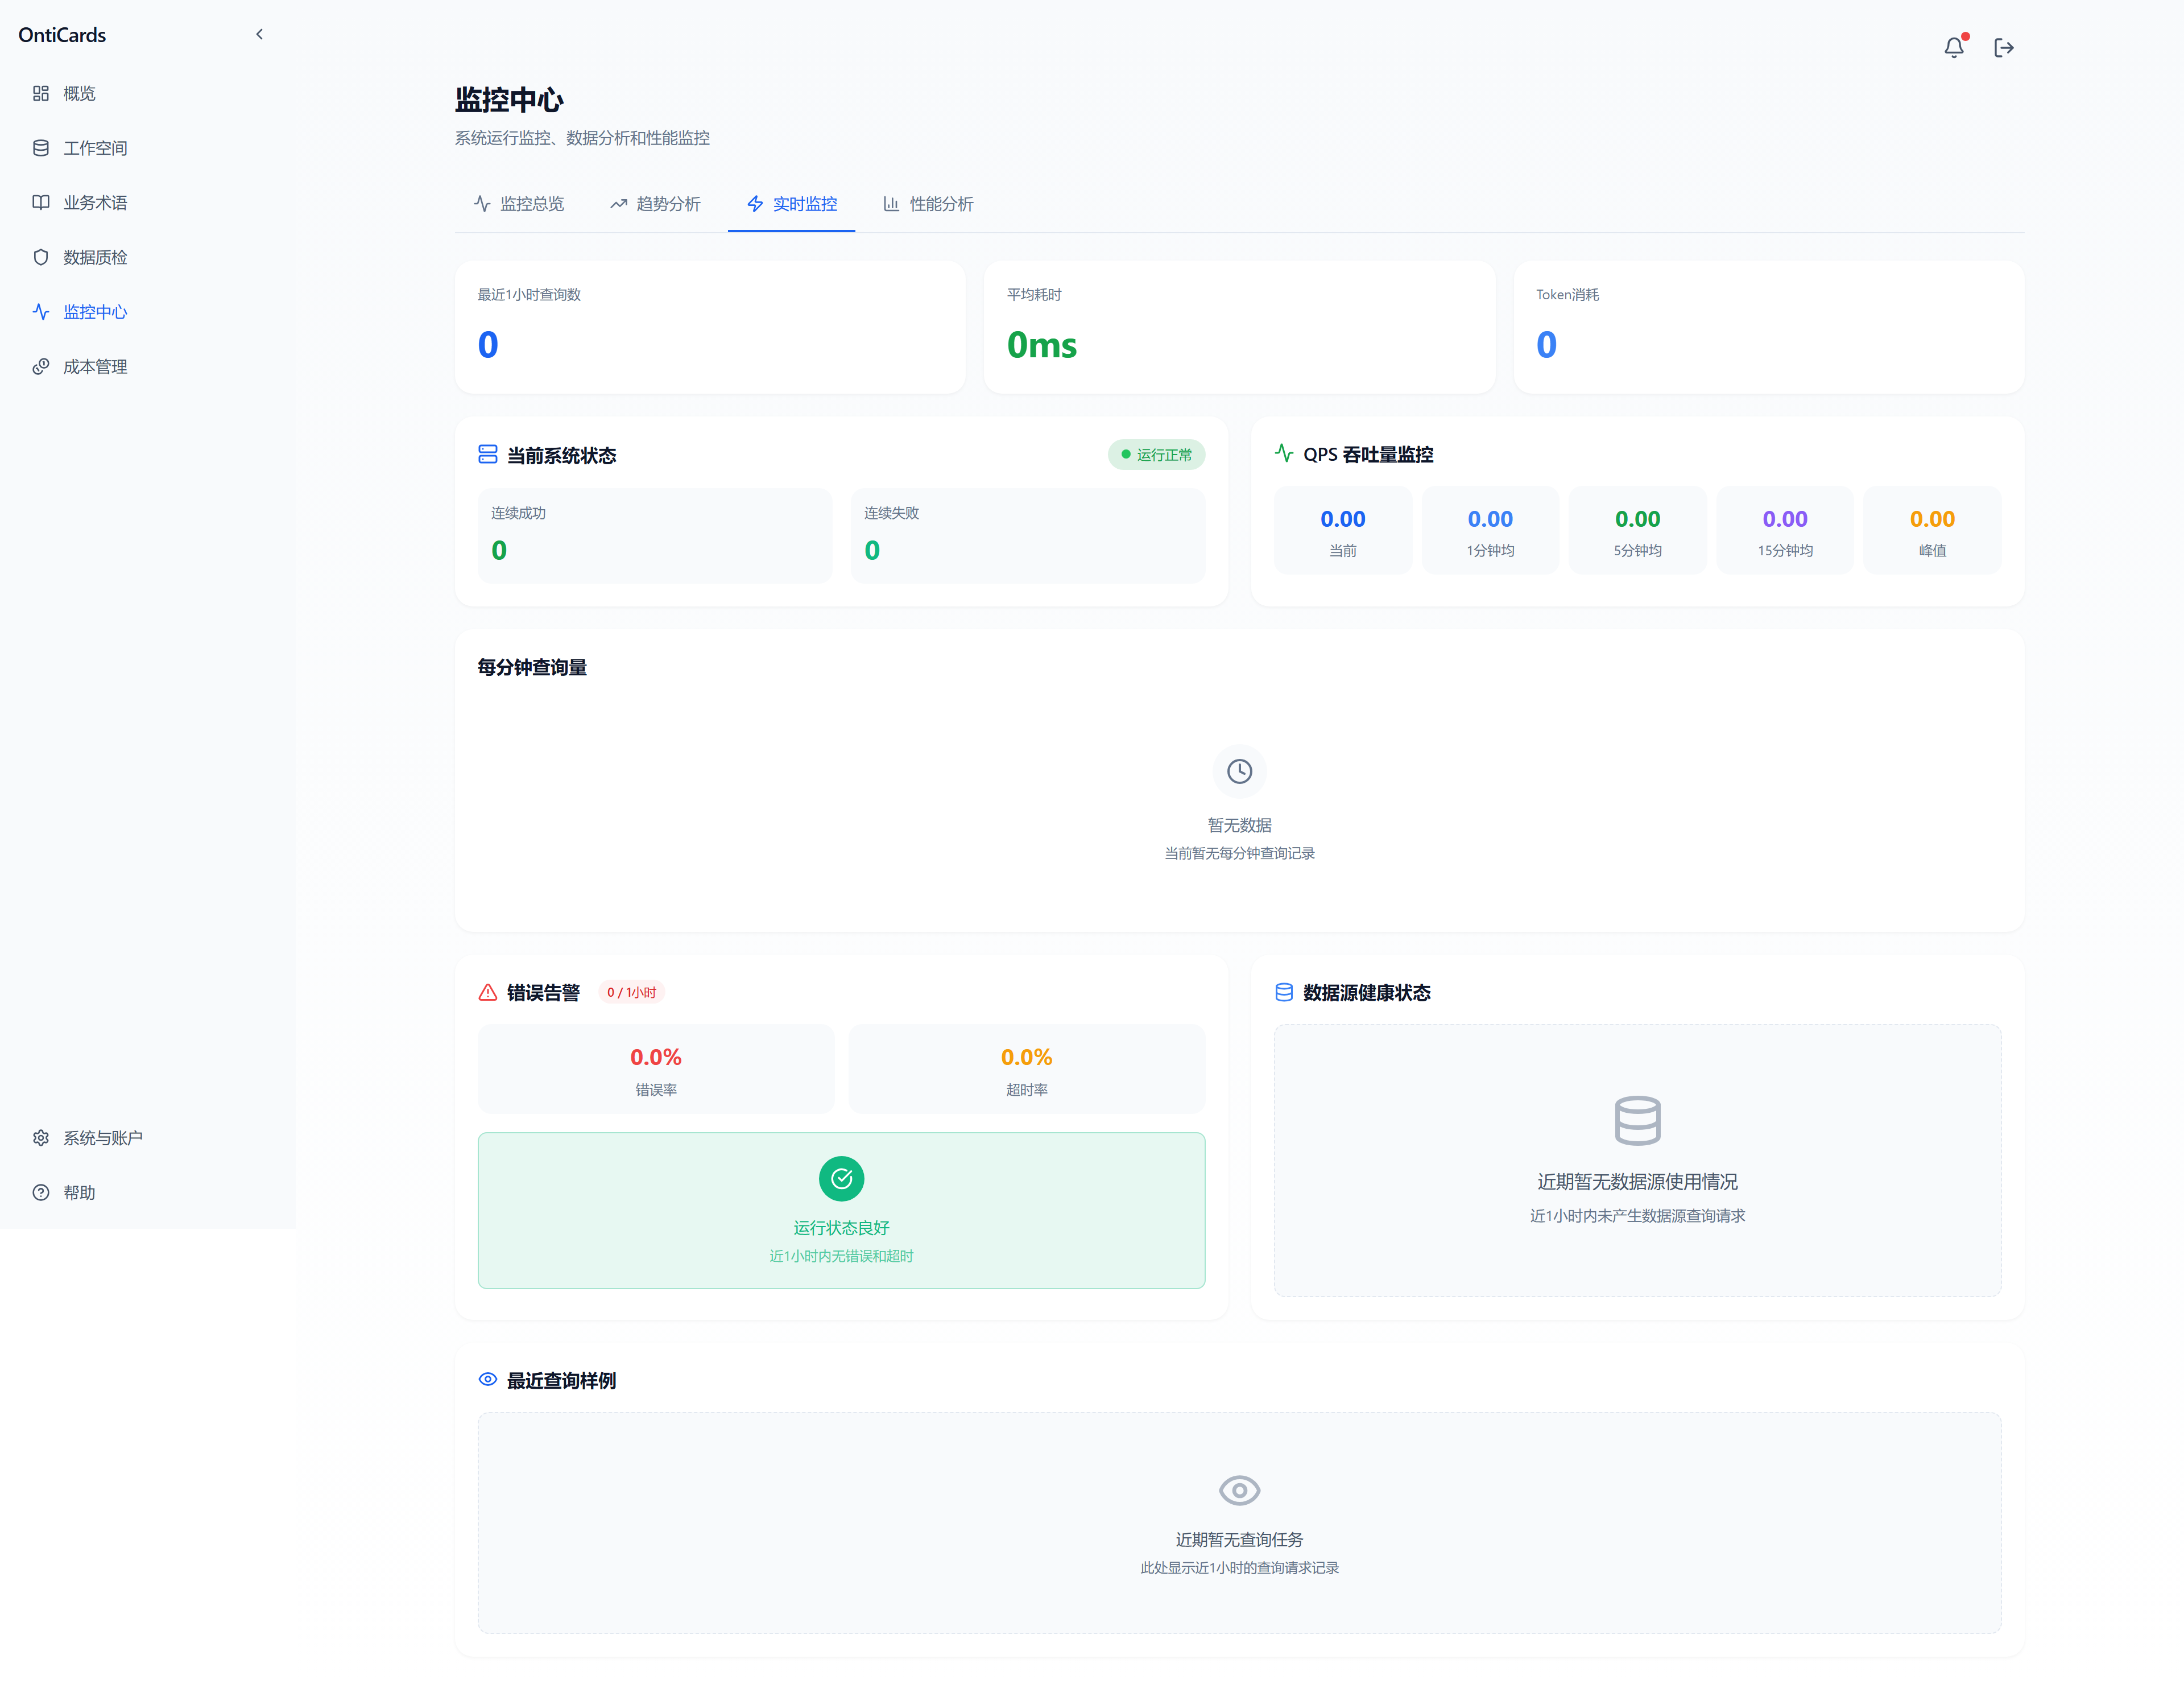
- Top 3 cards (last 1 hour): query count / average duration / Token consumption
- Current system status: successful connections / failed connections / normal-running badge
- QPS throughput monitoring: current / 1-min average / 5-min average / 15-min average / peak
- Queries per minute: a scrolling real-time line chart (shows a "no data" placeholder when empty)
- Error alerts: error rate, timeout rate (shows a green "running well" notice when both are 0)
- Data source health: marks data sources with no recent usage and suggests querying them to generate requests
- Recent query samples: scrolling list of query tasks from the last hour
- Auto refresh
10.4 Performance Analysis
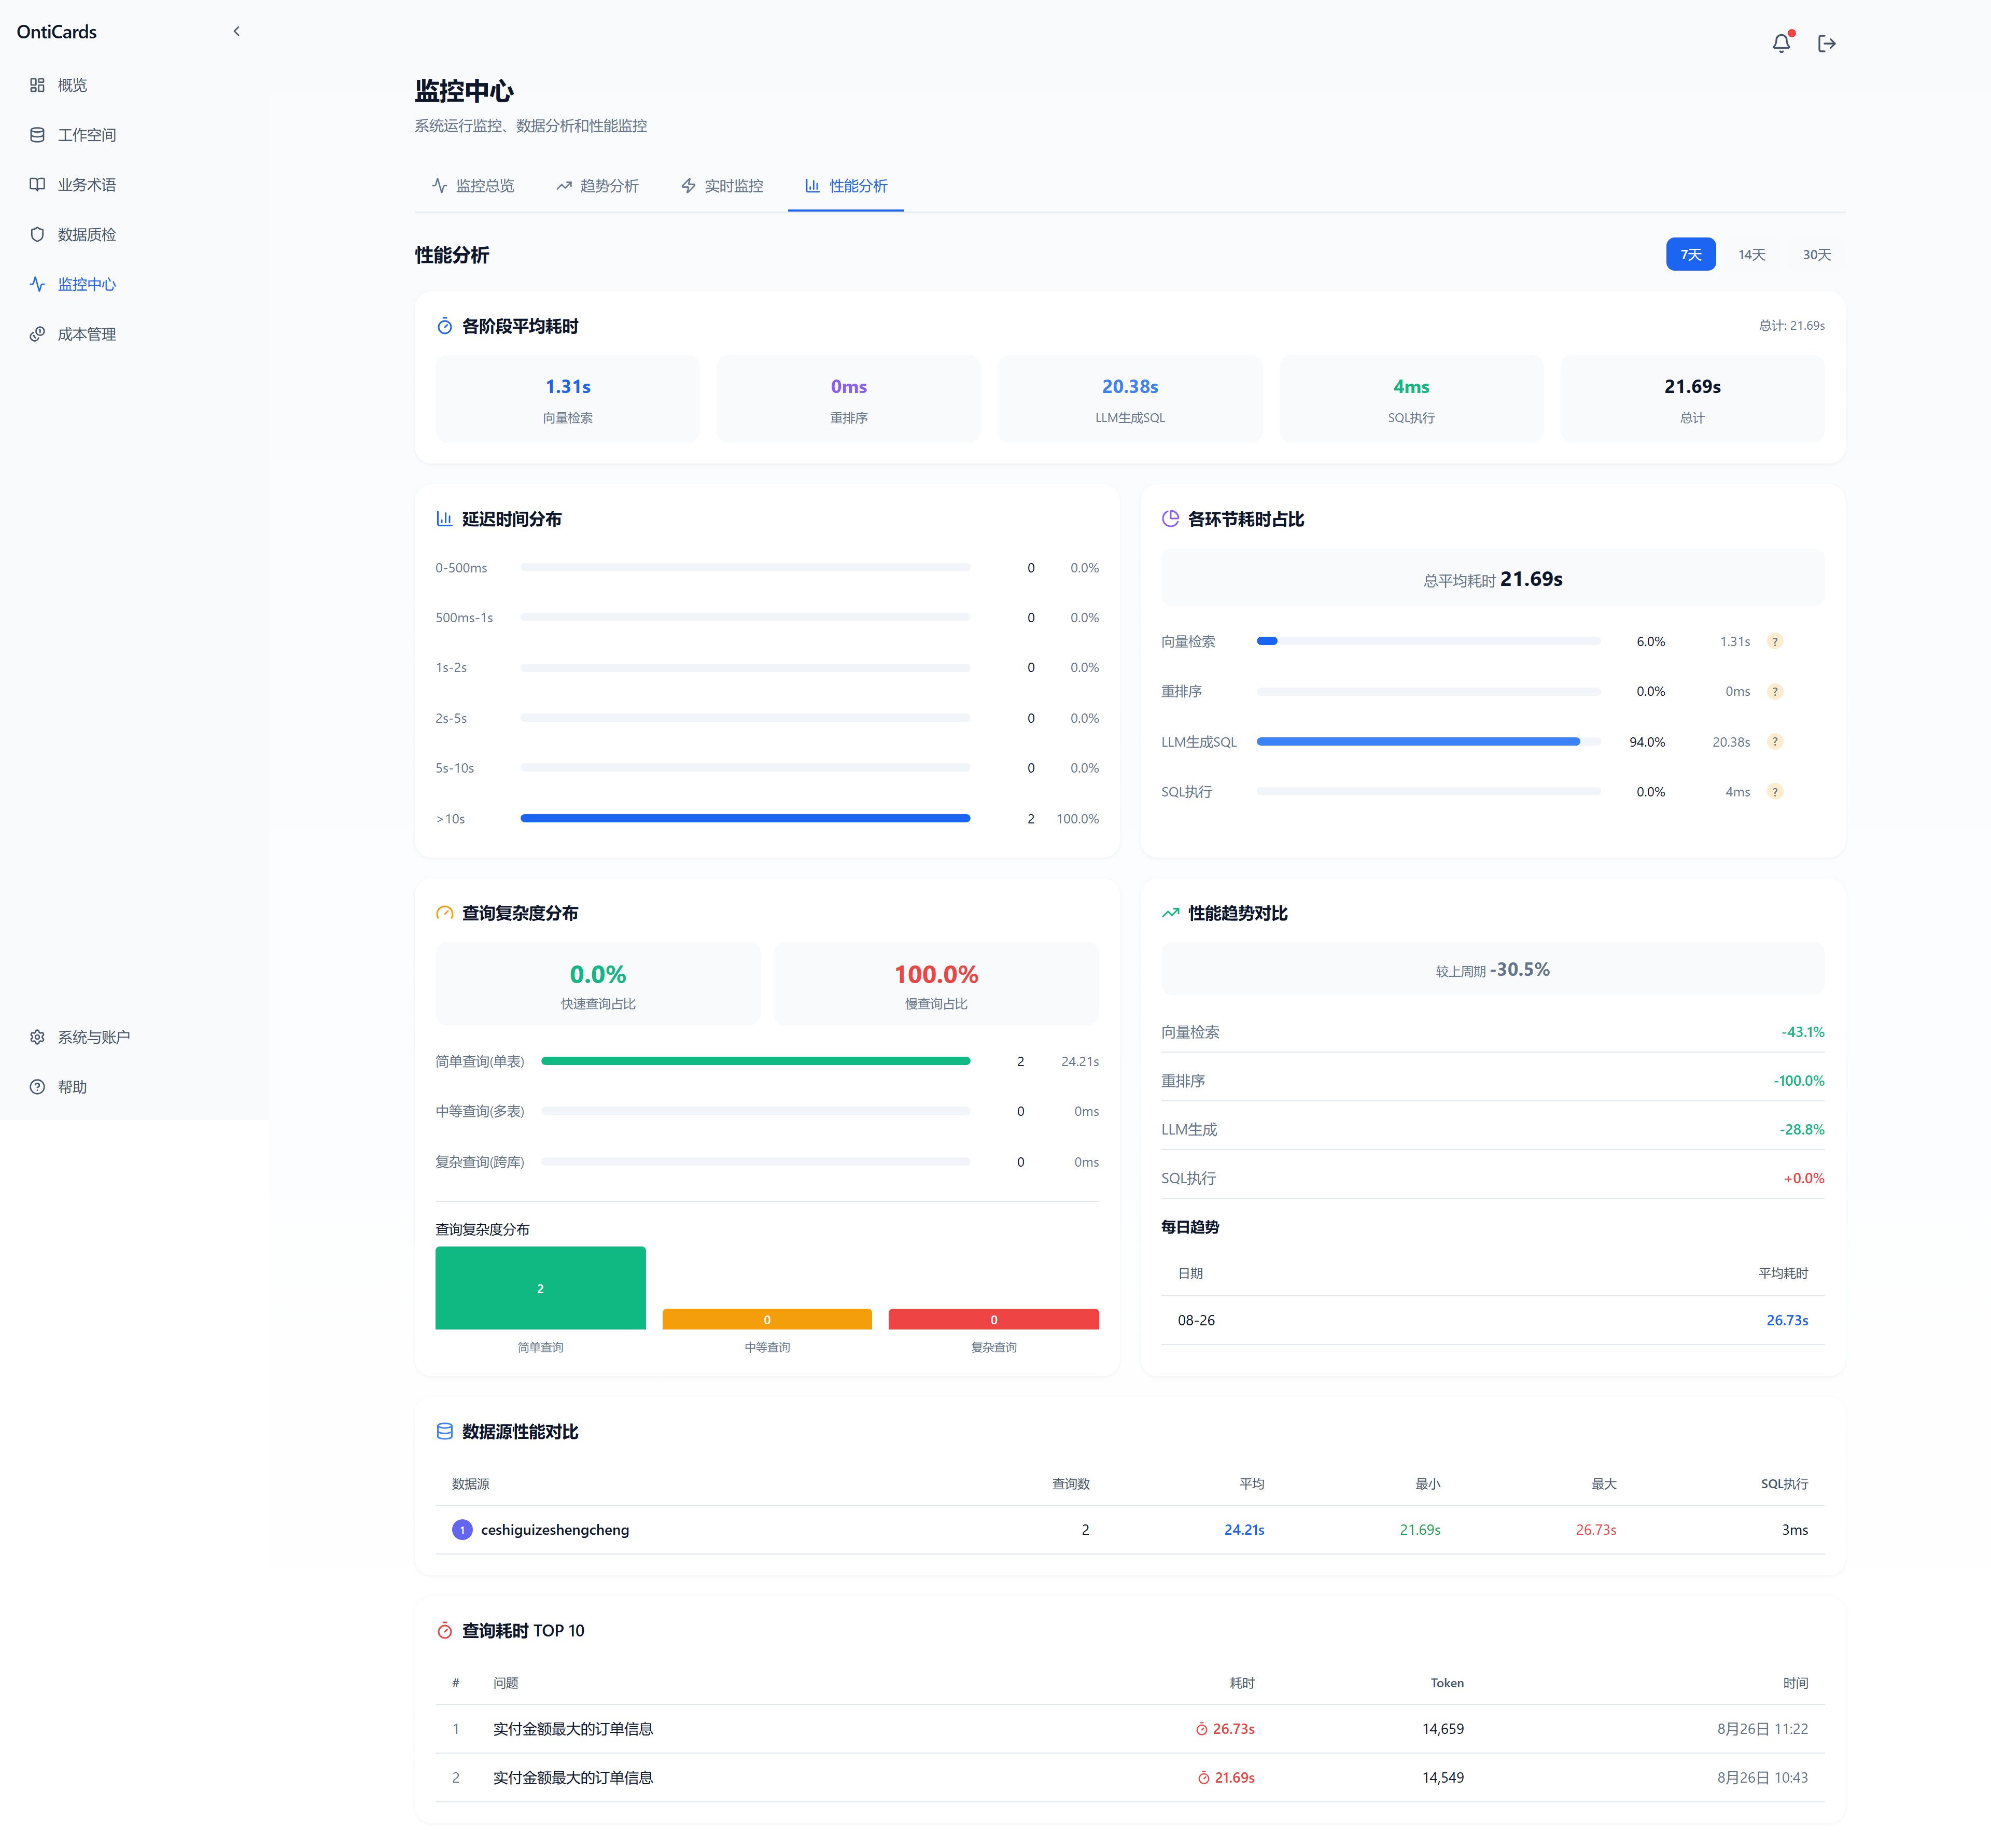
- Switch between time ranges (7 days / 14 days / 30 days)
- Average duration by stage cards (5 cards): vector retrieval, reranking, LLM SQL generation, SQL execution, total
- Latency distribution: 0-500ms / 500ms-1s / 1s-2s / 2s-5s / 5s-10s / >10s, 6 buckets
- Stage duration share: horizontal bar chart showing each stage's share plus the change vs. the previous period
- Query complexity distribution: share of simple queries (single table) / medium queries (multi-table) / complex queries (cross-database)
- Performance trend comparison: total average duration vs. the previous period, plus per-stage period-over-period changes (e.g. vector retrieval -43.1%)
- Daily trend: average duration by day
- Data source performance comparison: query count, average duration, min/max duration, and SQL execution per row
- Top 10 slow queries: lists the top 10 slow queries (question, duration, Token, time)
11. Cost Management
The Cost Management module provides Token price rule configuration and cost statistics, helping you track query costs in real time, control the budget, and optimize model usage.
11.1 Token Price Configuration
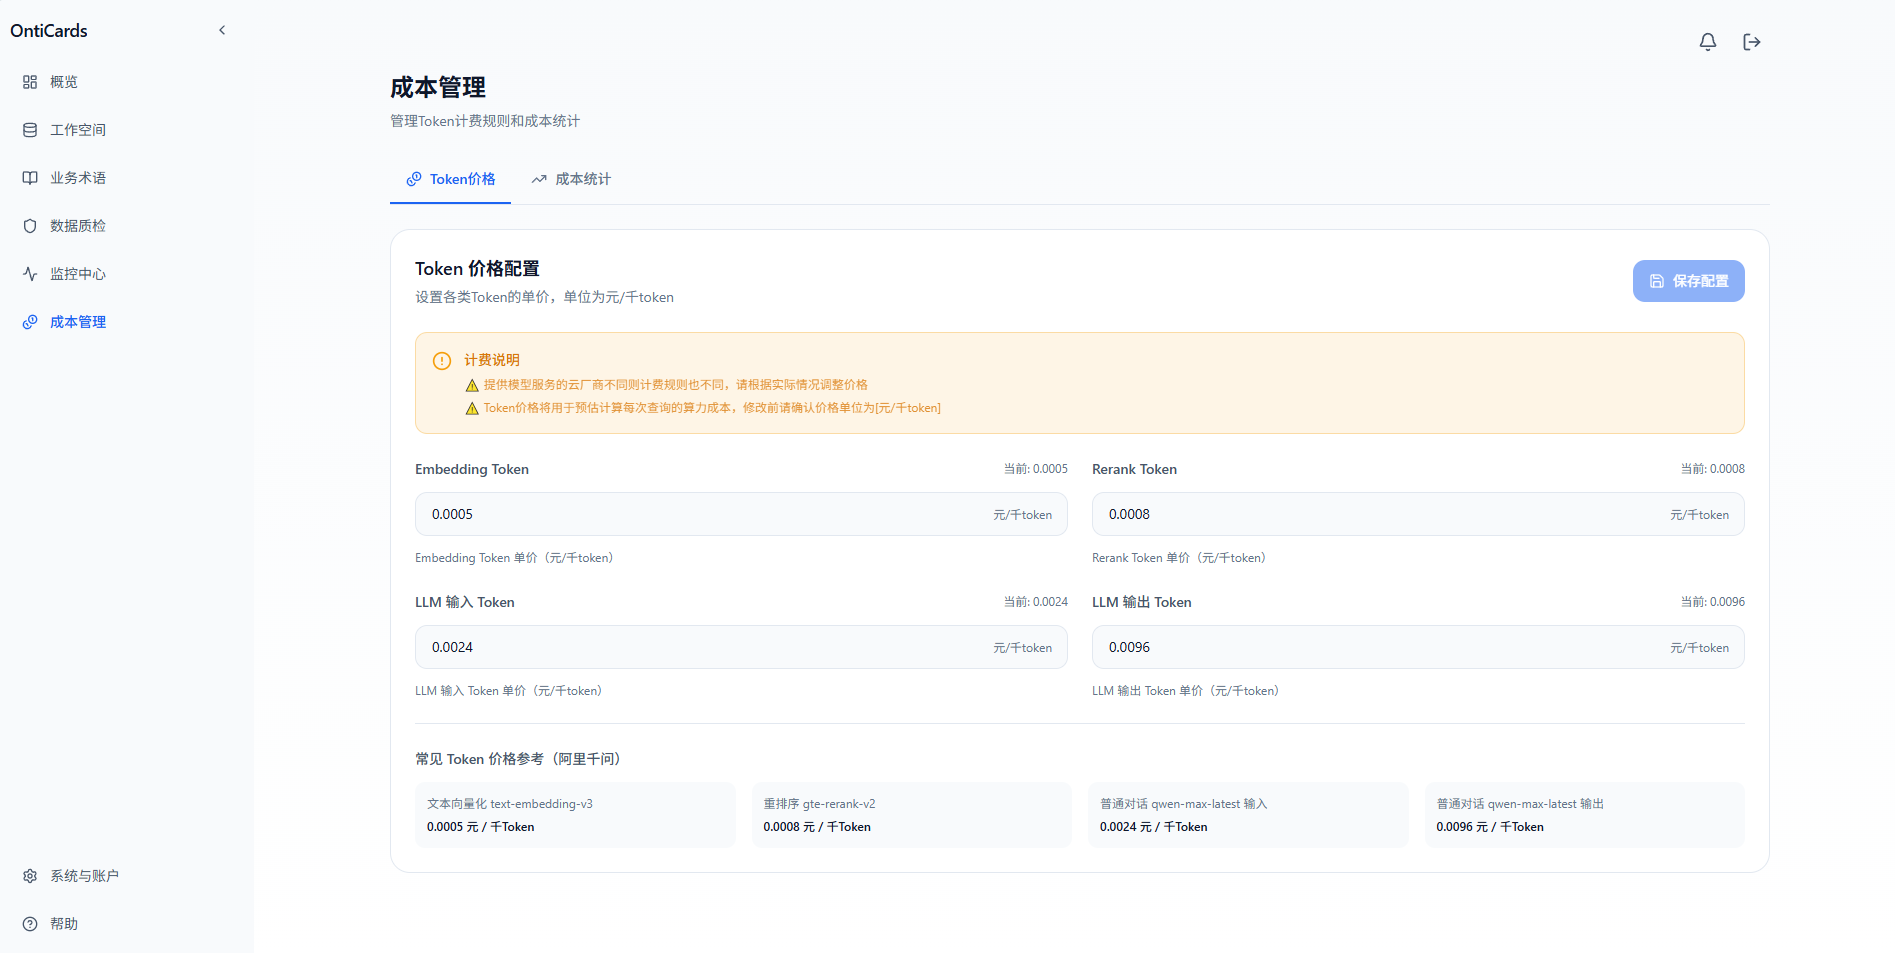
Unit prices can be configured for different model components:
| Setting | Default | Description |
|---|---|---|
| Embedding price | ¥0.0005 / 1K tokens | Vector retrieval cost |
| Rerank price | ¥0.0008 / 1K tokens | Reranking cost |
| LLM input price | ¥0.0024 / 1K tokens | SQL generation input |
| LLM output price | ¥0.0096 / 1K tokens | SQL generation output |
💡 The actual unit price depends on the LLM service you purchase; adjust the model and its price in System & Account → Model Configuration.
11.2 Cost Statistics
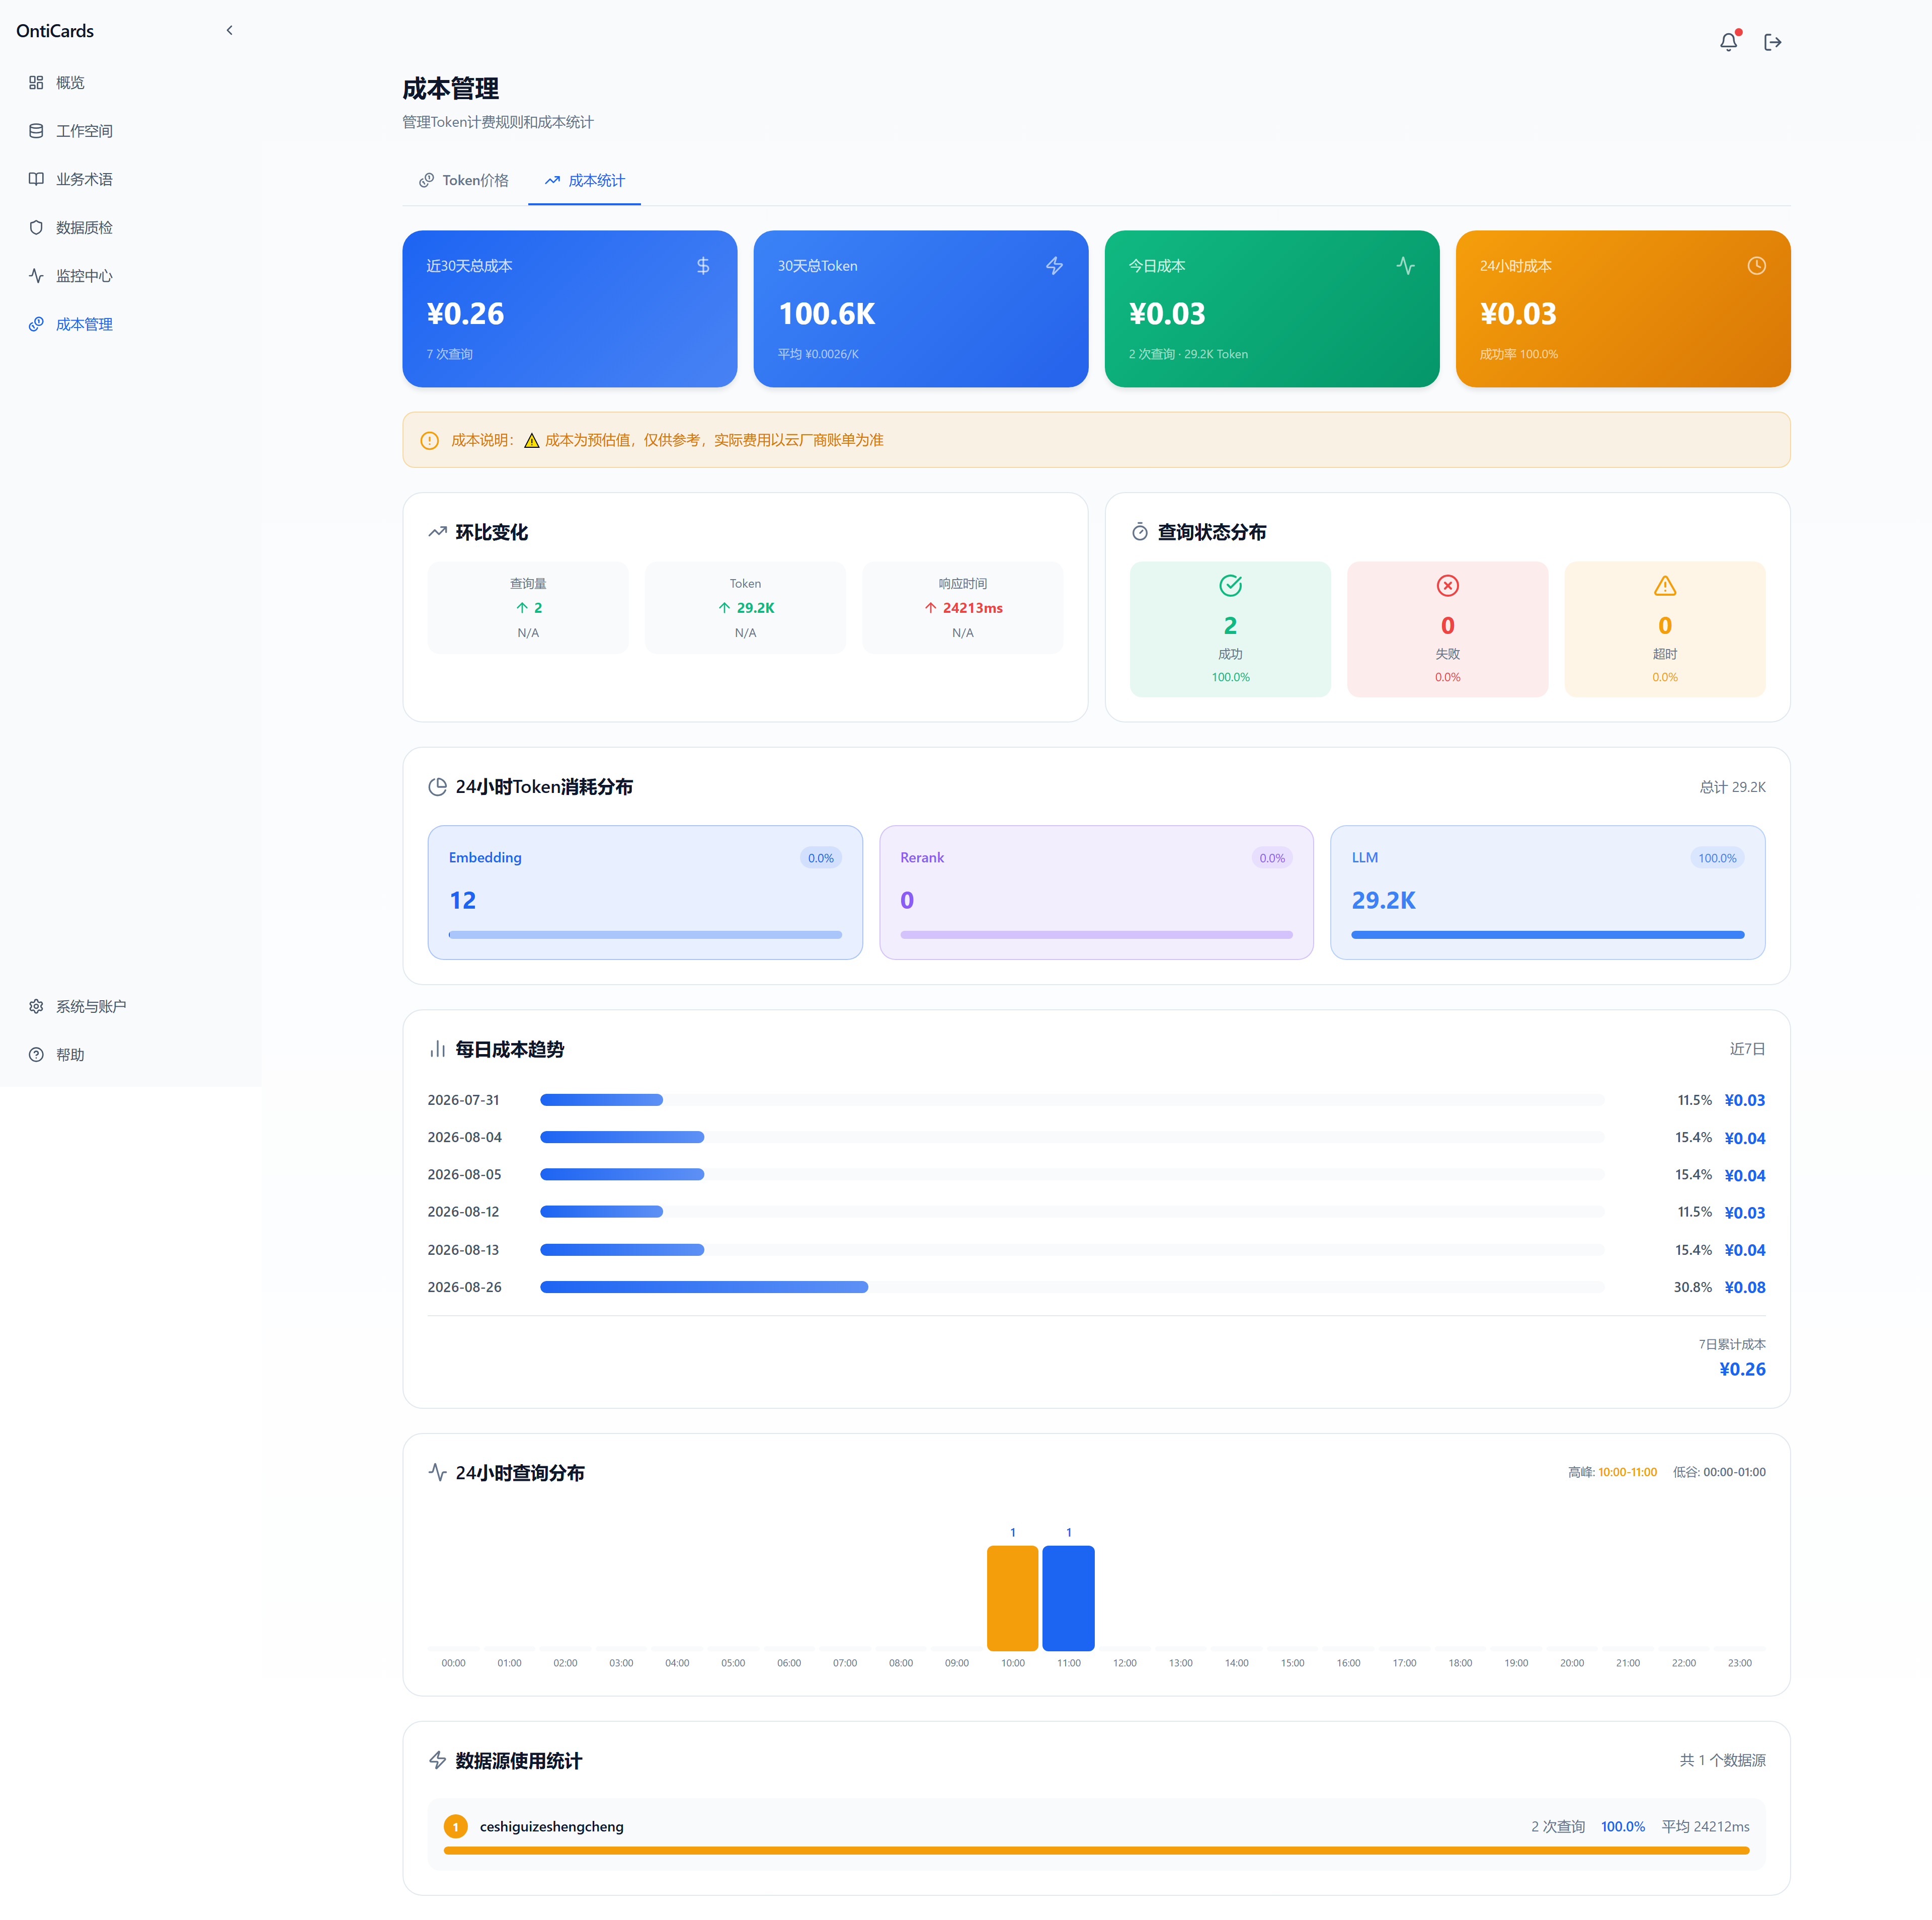
Top metric cards:
- Total cost in the last 30 days
- Total Token in 30 days
- Today's total cost
- 24-hour cost
Period-over-period changes: query count, Token, response time
Query status distribution
24-hour Token consumption distribution:
By component (Embedding / Rerank / LLM)
Daily cost trend (last 7 days):
Horizontal bar chart of daily costs, with the share and amount shown on the right.
24-hour query distribution:
A bar chart of query volume over 24 hours (30-minute granularity)
Data source usage statistics:
Token consumed and cost share of each data source.
⚠️ Cost note: costs are estimates for reference only. Actual charges follow the cloud vendor's bill.
12. System and Account
Go to System & Account / Settings:
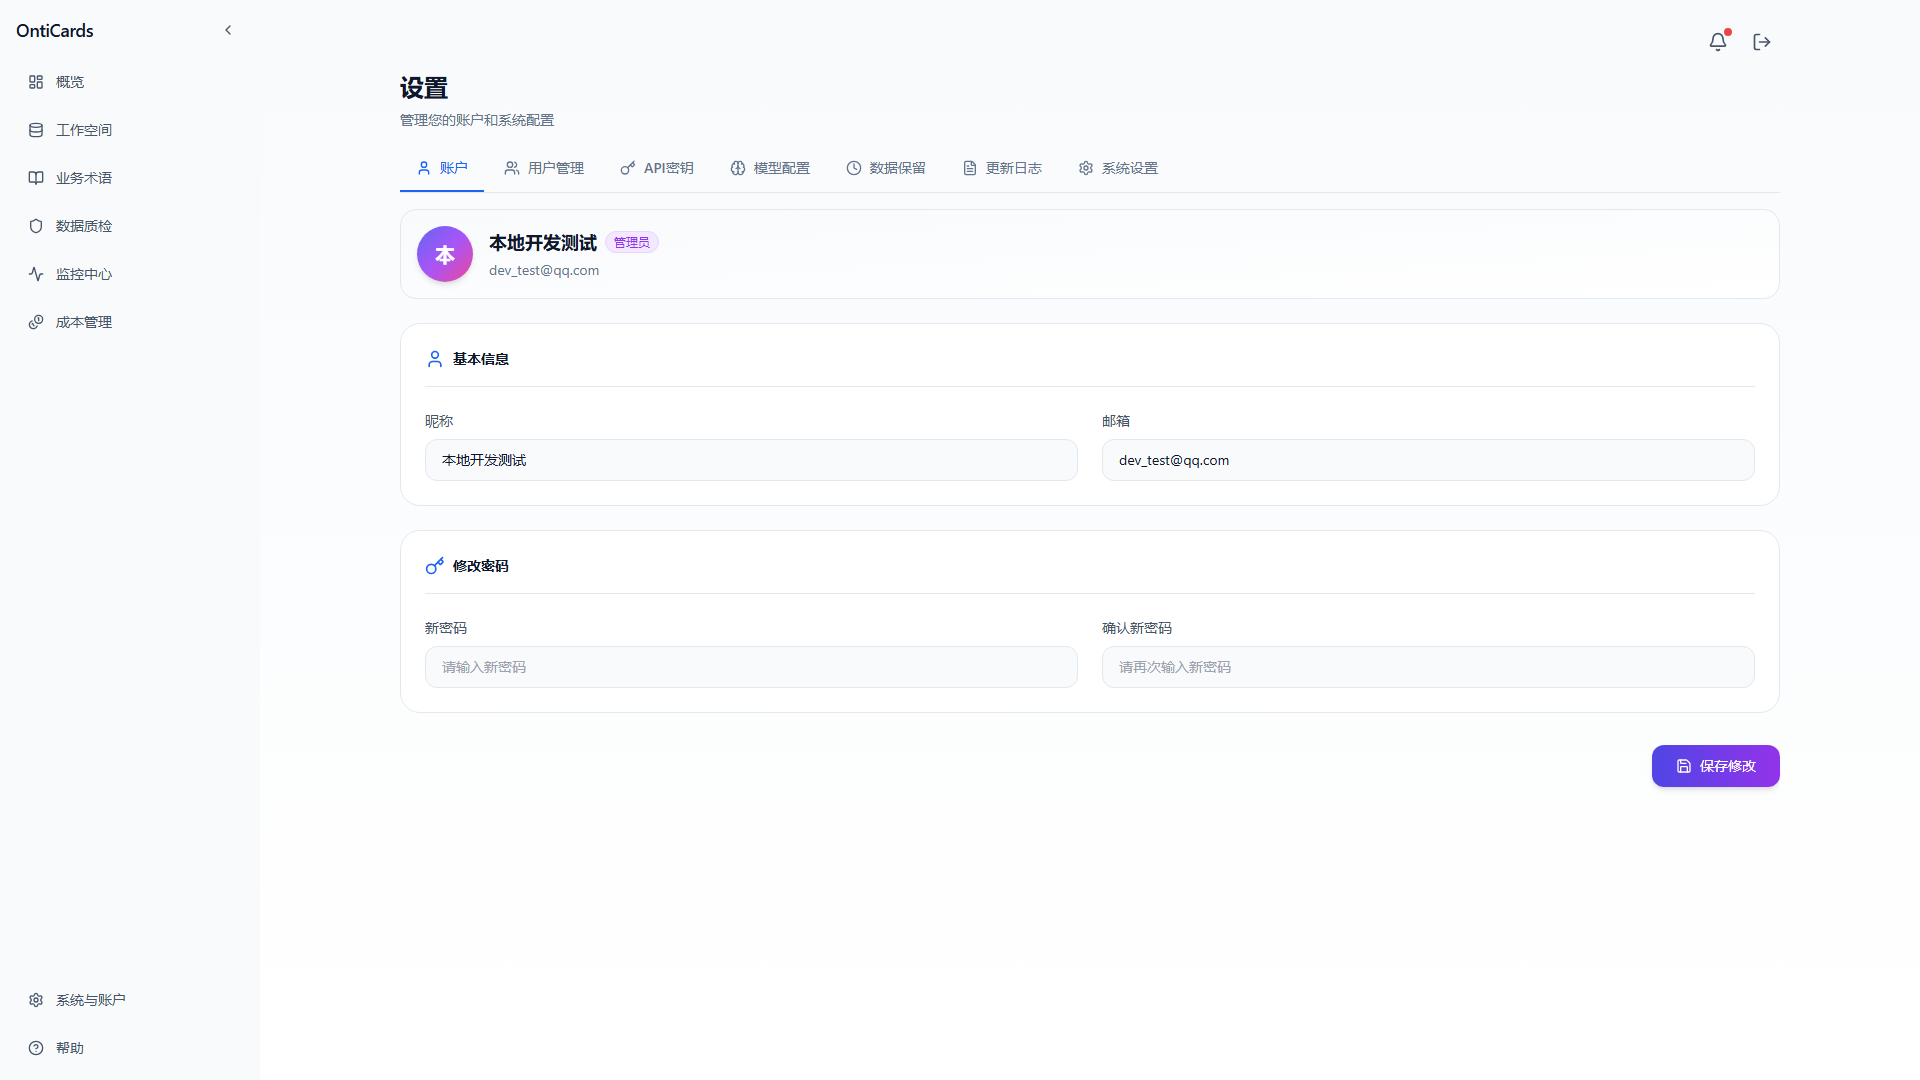
The settings center contains 7 sub-modules:
| Tab | Purpose |
|---|---|
| Account | Personal basic info, password change |
| User Management | Manage system users (admin only) |
| API Keys | Manage API Keys for third-party calls |
| Model Configuration | Configure AI models (chat, embedding, reranking) |
| Data Confidentiality | Sensitive field masking configuration |
| Audit Logs | Login and operation audit logs |
| System Settings | System-level configuration |
12.1 Account Information
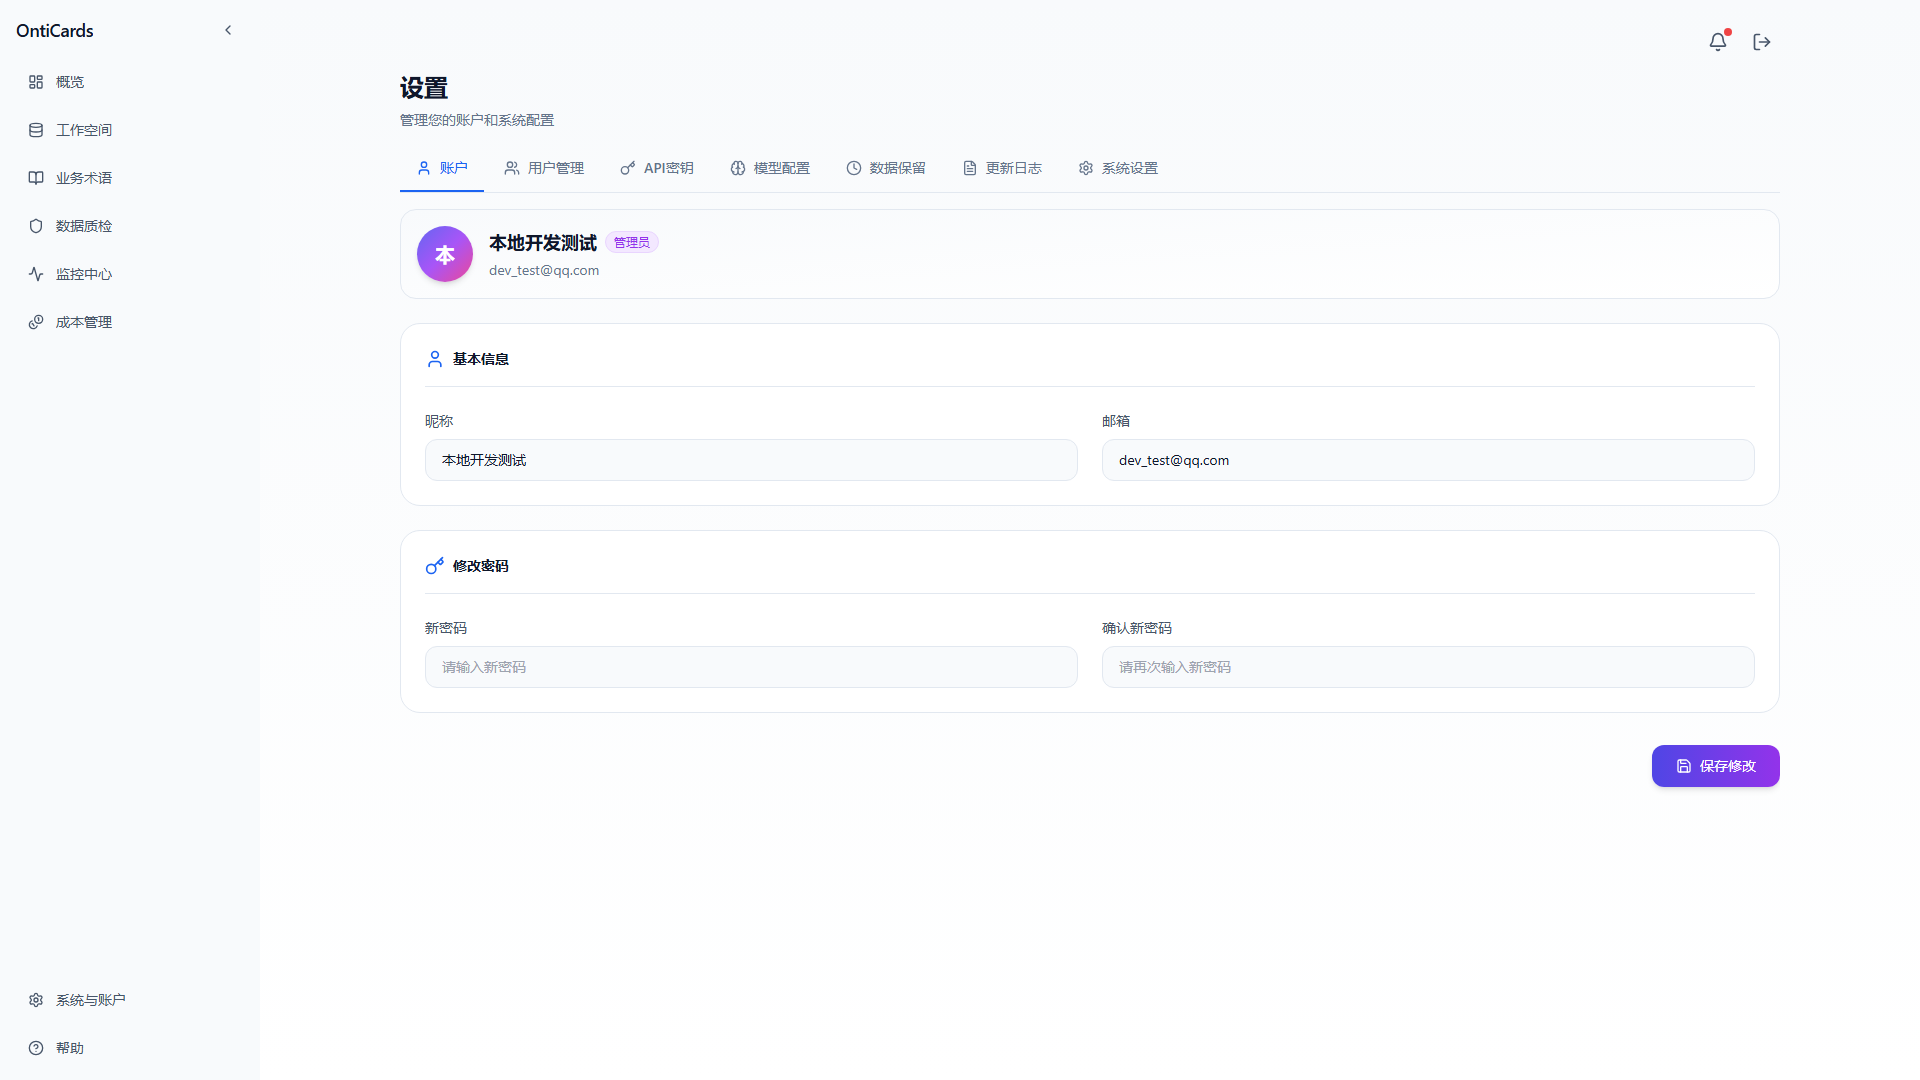
- Avatar, nickname
- Email (for password recovery)
- Change password
- Save Changes to submit
12.2 User Management
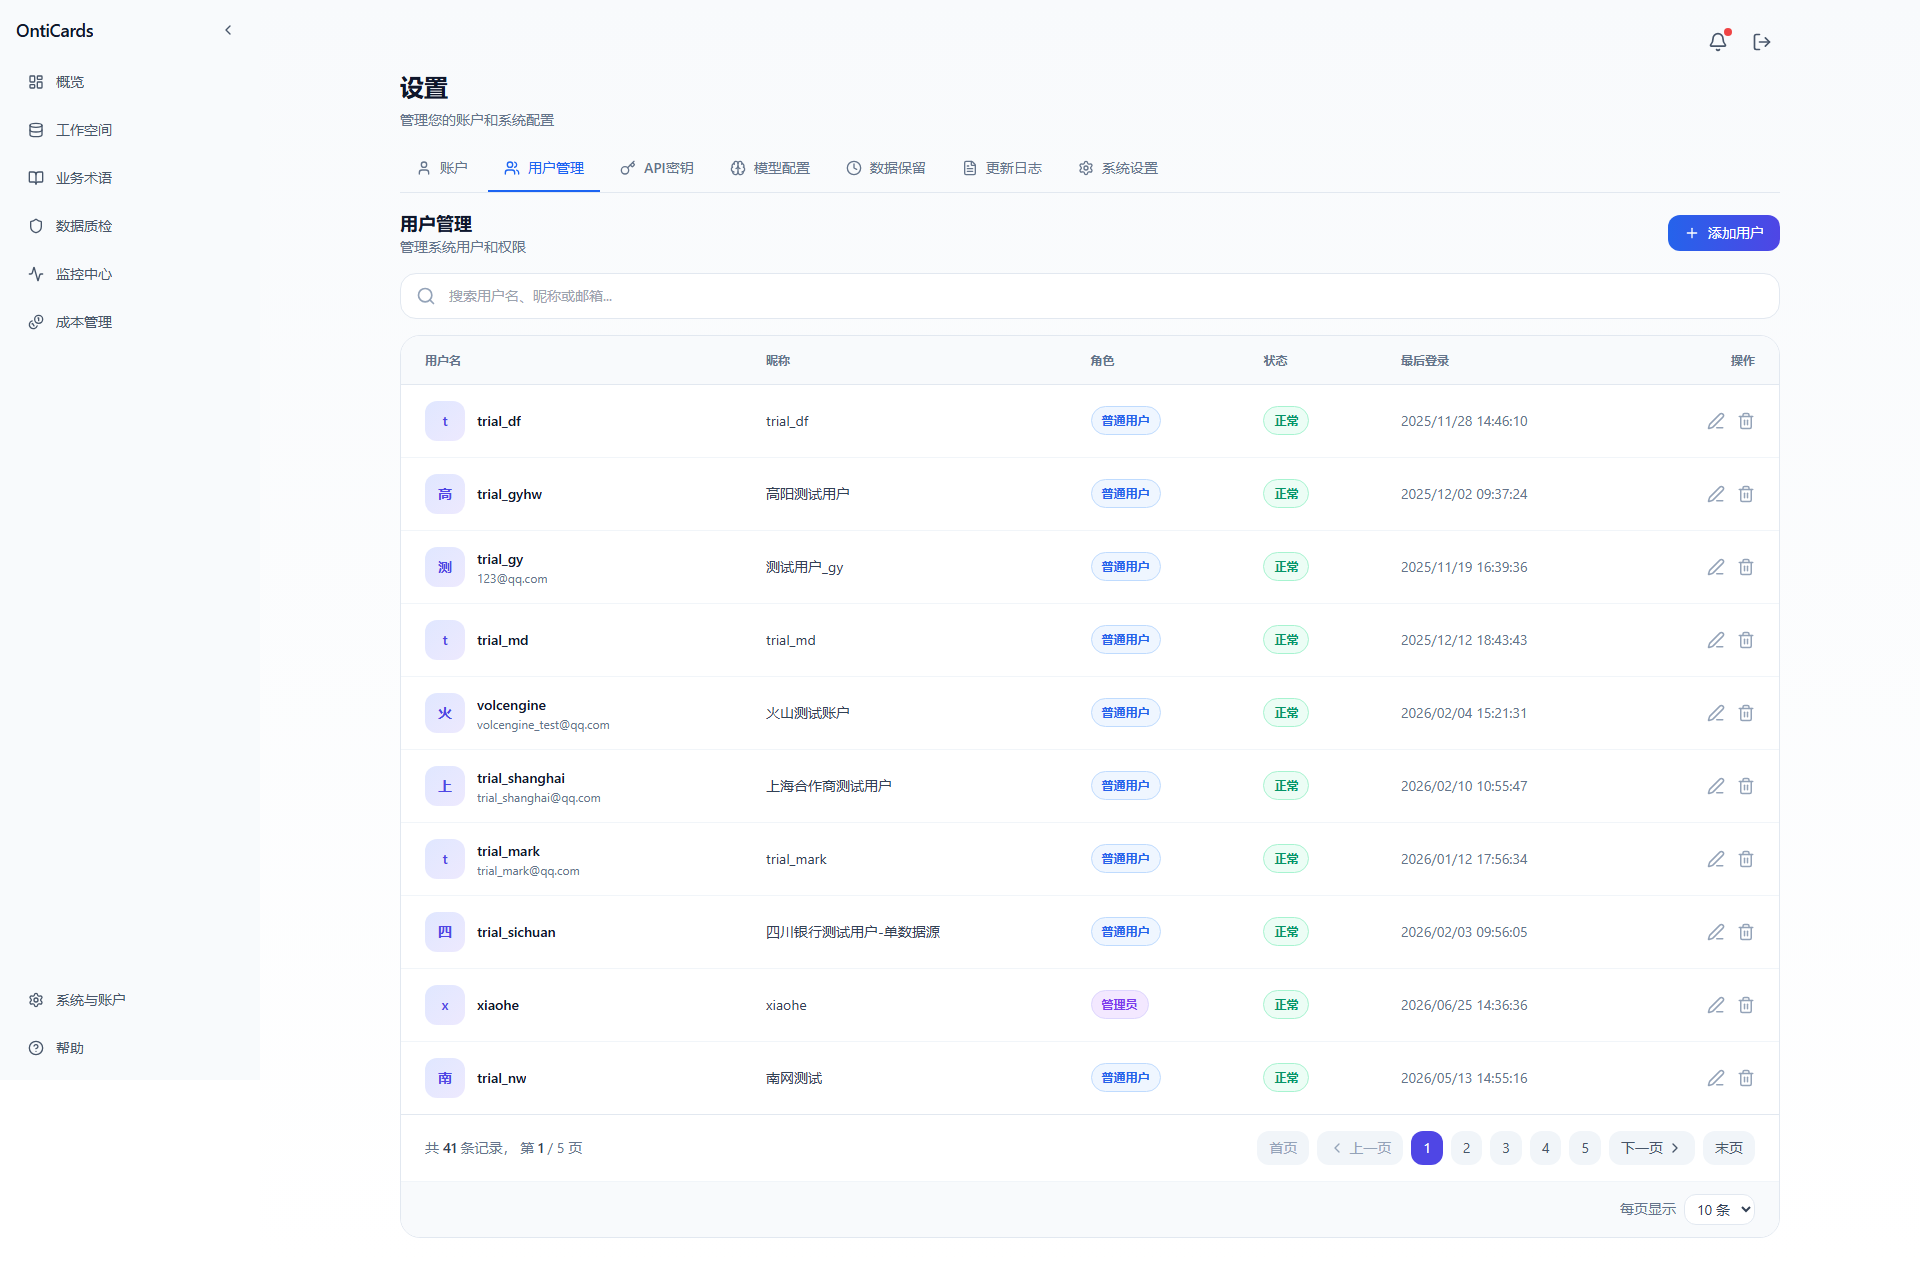
Visible to administrators only. Provides:
- User list: username, nickname, role, status, last login time
- Search: by username, nickname, email
- Add user: the Add User button in the top right
- Edit user: the Edit icon at the end of each row
- Delete user: the Delete icon at the end of each row
- Pagination: N records in total, page through as needed
Roles include:
- Administrator: has all permissions
- Regular user: restricted feature access
12.3 API Keys
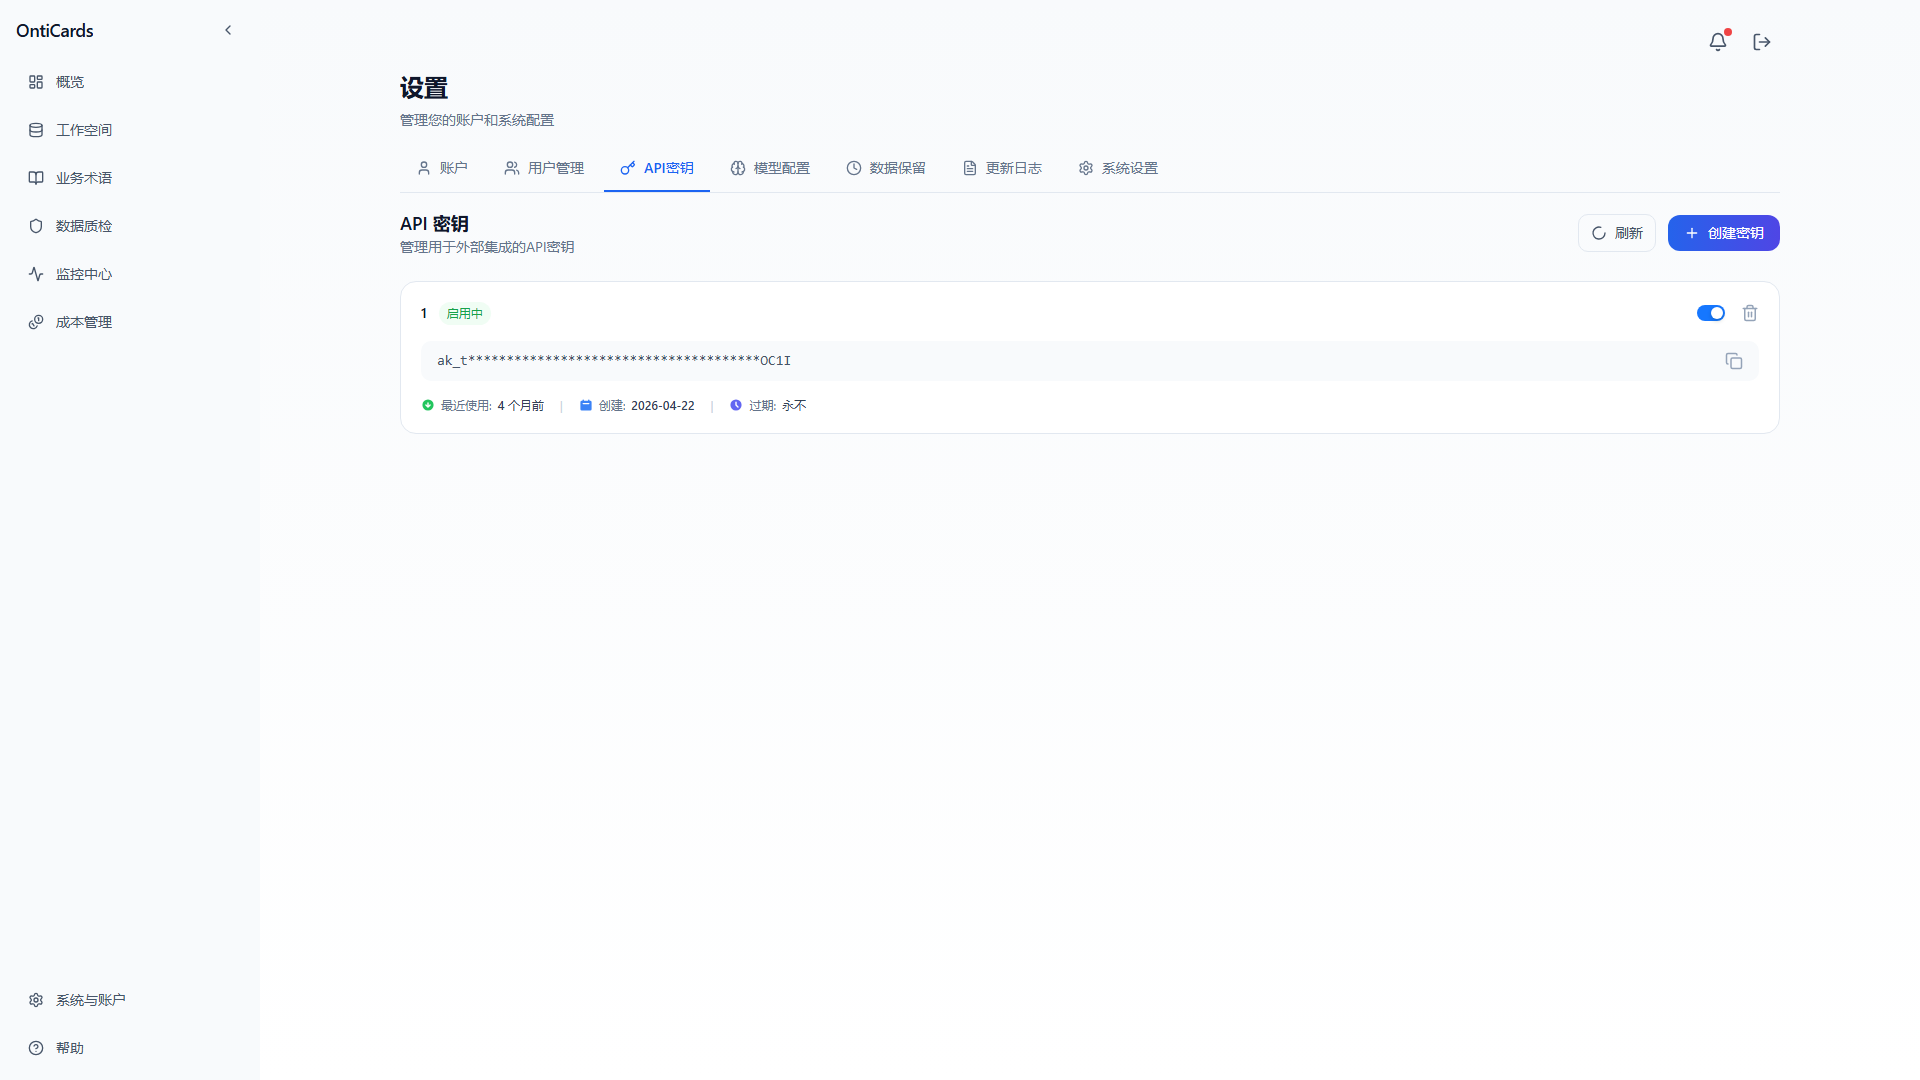
Used for third-party system integration. Provides:
- API key list
- Status display (enabled / disabled)
- Create Key to generate a new API Key
- Copy the key value
- Enable/disable and delete keys
Usage:
curl -X POST https://your-host/api/v1/query \
  -H "Authorization: Bearer ak_xxxxxxxxxxxxx" \
  -H "Content-Type: application/json" \
  -d '{
    "question": "查询最近 7 天的订单量",
    "data_source_id": 1
  }'
🔐 Security note: keep your API keys safe and rotate them regularly. If a key is leaked, disable it immediately and create a new one.
Detailed interface documentation: API Reference
12.4 Model Configuration
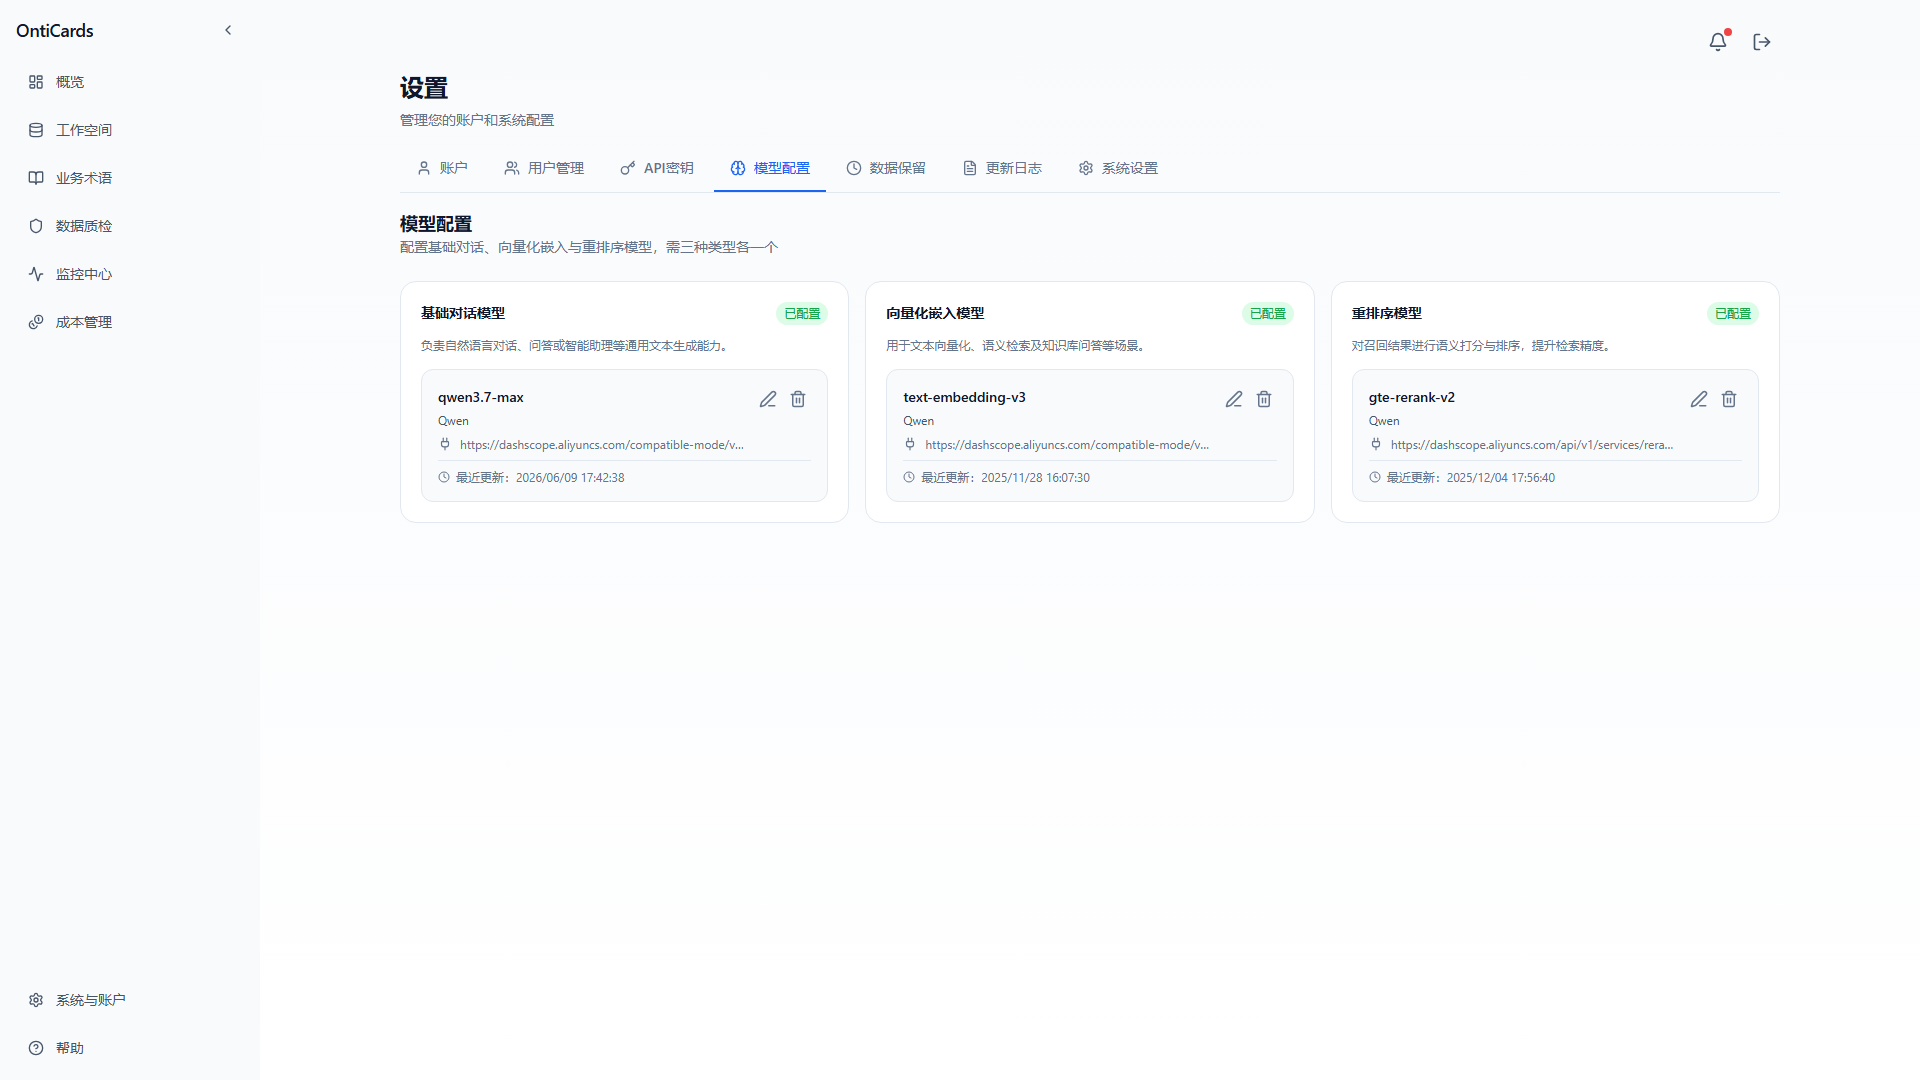
OntiCards depends on 3 types of AI models:
| Model type | Role | Configuration fields |
|---|---|---|
| Chat model | Natural-language understanding, SQL generation | Name, OpenAI-compatible API URL, API Key |
| Embedding model | Converts text to vectors for retrieval | Name, OpenAI-compatible API URL, API Key |
| Rerank model | Optimizes retrieval result ordering | Name, OpenAI-compatible API URL, API Key |
Configuration steps:
- Select a model type card
- Name (e.g.
qwen3.7-max)
- An OpenAI-compatible API URL (e.g.
https://dashscope.aliyuncs.com/compatible-mode/v1)
- API Key
- Fill in:
- Test the connection
- Enable
✅ The system supports any OpenAI-compatible endpoint, including Alibaba Cloud Qwen, DeepSeek, OpenAI, Azure OpenAI, and Anthropic.
12.5 Data Confidentiality
Used to configure sensitive field masking:
- Select a data source
- Select the fields to mask
- Select the masking policy (partial mask, hash, set to empty)
- Applied to query result display
Masked fields are:
- Displayed according to the policy in query results
- Displayed according to the policy in exported files
- Unaffected in the original database
12.6 Audit Logs
Records all user operations:
- Login / logout
- Data source add / modify / delete
- Rule add / execution
- API calls
- Sensitive operations
Each record contains: user, time, IP, operation type, object, result.
12.7 System Settings
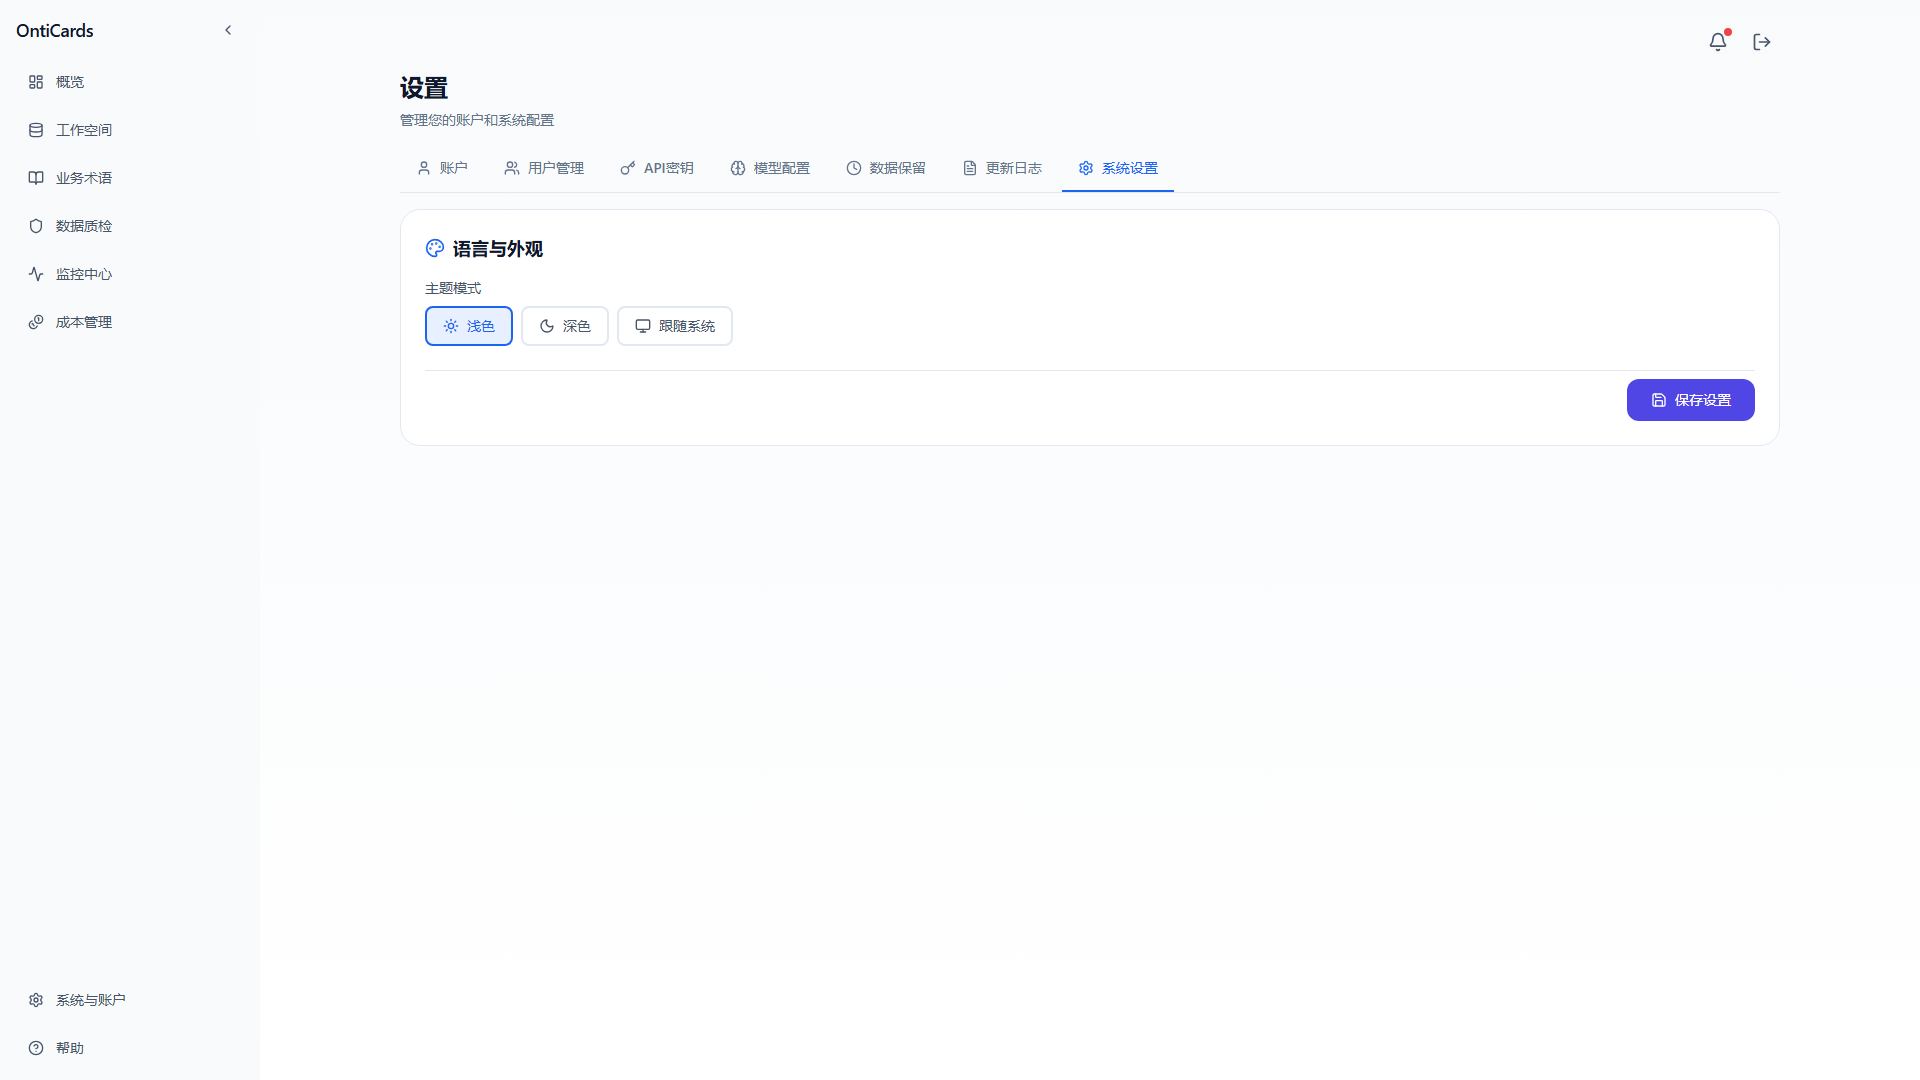
System-level configuration:
- Default theme (light / dark)
13. Data Security
OntiCards protects data on multiple levels:
13.1 Access Isolation
- Users and data sources have a many-to-one relationship
- Each user can only access the data sources they added
- Data sources of different users are invisible to each other
- Workspaces and glossaries are isolated per user
13.2 Read-Only Protection
- The system only executes SELECT (query) operations
- No entry points are provided for INSERT / UPDATE / DELETE / DROP / ALTER
- All generated SQL passes a safety check
- Dangerous keywords (such as
DROP,TRUNCATE) are forcibly filtered
13.3 Password Protection
- Database passwords are stored with an encryption algorithm (AES-256)
- Passwords never appear in the UI, query results, or logs
- Passwords are encrypted with HTTPS in transit
- Passwords are automatically masked when switching data sources
13.4 Operation Auditing
- All key operations of every user are recorded
- Including: time, user, IP, operation type, object, result
- Audit logs are tamper-proof (append-only)
- Export is supported, as is integration with third-party SIEM
13.5 Sensitive Data Masking
- Field-level masking policies
- Query results are masked according to the policy
- API responses are masked according to the policy
- Original data storage is unaffected
13.6 SSO and MFA
- JWT Token mode SSO is supported
- Can integrate with enterprise identity systems (LDAP, AD, OAuth2.0, OIDC, CAS)
- Multi-factor authentication (MFA) can be enabled
🔐 For the full JWT-mode SSO integration flow, see Chapter 15 SSO Single Sign-On Integration (JWT Mode).
14. API and Third-Party Integration
OntiCards exposes its core capabilities through a REST API and can integrate with the following systems:
- AI agents: embed "natural-language querying" into an AI Agent
- RPA / automation platforms: run scheduled queries automatically and push the results
- BI platforms: act as an "AI query" enhancement layer for BI
- WeCom / DingTalk / Feishu bots: let users ask for data directly in IM
- In-house business systems: embed "ask for data" into business backends
14.1 Authentication
Authentication is done with an API Key:
Authorization: Bearer ak_xxxxxxxxxxxxxxxx14.2 Core Endpoints
| Endpoint | Method | Purpose |
|---|---|---|
/api/v1/query | POST | Submit a natural-language question |
/api/v1/query/{id} | GET | Get the query result |
/api/v1/datasources | GET | List data sources |
/api/v1/terms | GET | List business terms |
/api/v1/health | GET | Health check |
Example: natural-language query
curl -X POST https://your-host/api/v1/query \
  -H "Authorization: Bearer ak_xxxxxxxx" \
  -H "Content-Type: application/json" \
  -d '{
    "question": "查询最近 30 天的订单量",
    "data_source_id": 1
}'Response:
{
  "query_id": "q_abc123",
  "status": "success",
  "sql": "SELECT DATE(created_at) AS day, COUNT(*) FROM orders WHERE created_at >= NOW() - INTERVAL 30 DAY GROUP BY day",
  "data": [
    {"day": "2026-07-27", "count": 1234},
    {"day": "2026-07-28", "count": 1456}
  ],
  "duration_ms": 412,
  "tokens": 1432
}
Full API documentation: API Reference
14.3 Webhook
Webhooks can be configured to push notifications on the following events:
- Query completed
- Quality check report generated
- Data source error
15. SSO Single Sign-On Integration (JWT Mode)
When your company already has its own user system (portal, OA, business systems), you can connect the OntiCards user system via JWT-mode SSO single sign-on: after users log in to your system, they can jump directly into OntiCards without entering credentials again.
🔐 This chapter is for developers responsible for the integration. Once SSO is configured, end users have the same login experience as normal login.
15.1 What Is a JWT Token
JWT (JSON Web Token) is an open standard (RFC 7519) for securely transmitting information between parties. A JWT consists of three parts, separated by dots:
eyJhbGciOiJIUzI1NiIsInR5cCI6IkpXVCJ9.eyJ1c2VybmFtZSI6InpoYW5nX3NhbiIsInVzZXJfaWQiOiJTWVNfVVNFUl8wMDEifQ.signature
|______________|.|__________________________________________|.______________|
Header | Payload | Signature| Part | Name | Purpose | Example content |
|---|---|---|---|
| 1 | Header | Declares the algorithm and token type | {"alg":"HS256","typ":"JWT"} |
| 2 | Payload | Holds the actual user data | {"username":"zhang_san","user_id":"001",...} |
| 3 | Signature | Signs the first two parts with the secret key to ensure they have not been tampered with | SflKxwRJSMeKKF2QT4fwpMeJf36POk6yJV_adQssw5c |
15.2 Overall Flow
1. The customer's backend generates a JWT Token
   ↓
2. Build the SSO login URL (with token and redirect_url)
   ↓
3. The user's browser redirects to OntiCards' SSO endpoint
   ↓
4. OntiCards verifies the JWT, creates/links the user, and generates its own Token
   ↓
5. The browser redirects to redirect_url with OntiCards' Token
   ↓
6. The customer's frontend receives the Token; login is complete
💡 Automatic user linking: on the first SSO access, OntiCards looks up an existing user byuser_id+source; new users are created automatically and existing users are linked directly, with no manual account provisioning.
15.3 Configuration Checklist
The following configuration must be prepared before integration:
| Configuration item | Description | Example value |
|---|---|---|
| SSO shared secret | Used for JWT signing; both sides must match | K7x#9mP$2nL5@qR8 (a random string of 64+ characters is recommended) |
| OntiCards API URL | OntiCards' SSO login endpoint | https://api.onticards.com |
| Redirect URL | The frontend page to jump to after login | https://frontend.onticards.com/overview |
Server-side configuration: set the shared secret in OntiCards' server-side .env (see the Deployment Guide):
SSO_SECRET_KEY=shared secret provided by the customer15.4 Token Generation in Detail
Token generation must be done on the customer's backend (the shared secret must never be exposed on the frontend).
① Header: fixed format, declaring the HS256 algorithm, then Base64URL-encoded:
{
    "alg": "HS256",
    "typ": "JWT"
}
② Payload (user data): contains the user information to be passed:
| Field | Type | Required | Description |
|---|---|---|---|
username | string | ✅ | Unique identifier of the user; cannot be empty |
user_id | string | ✅ | User ID in the customer system; cannot be empty |
nickname | string | ❌ | User display name |
email | string | ❌ | User email |
source | string | ❌ | Origin identifier used to distinguish systems; defaults to default |
iat | number | ❌ | Token issue time (Unix timestamp) |
exp | number | ✅ | Token expiry time (Unix timestamp); recommended: 5 minutes from now |
③ Signature: join the first two parts with a dot, then sign with the shared secret:
Signature string = Header_base64 + "." + Payload_base64
Signature = HMAC-SHA256(Signature string, shared secret)
The final JWT Token:
JWT Token = Header_base64 + "." + Payload_base64 + "." + Signature_base6415.5 Examples in Different Languages
Python:
import jwt
from datetime import datetime, timedelta, timezone

SECRET_KEY = "your_shared_secret_key"  # Shared with the OntiCards server

payload = {
    "username": "zhang_san",
    "user_id": "SYS_USER_001",
    "nickname": "张三",
    "email": "zhangsan@example.com",
    "source": "your_app",
    "iat": datetime.now(timezone.utc),
    "exp": datetime.now(timezone.utc) + timedelta(minutes=5)  # Expires in 5 minutes
}

token = jwt.encode(payload, SECRET_KEY, algorithm="HS256")
print(token)
Java (jjwt 0.12+):
String token = Jwts.builder()
    .claims(Map.of(
        "username", "zhang_san",
        "user_id", "SYS_USER_001",
        "nickname", "张三",
        "email", "zhangsan@example.com",
        "source", "your_app"))
    .issuedAt(new Date())
    .expiration(new Date(System.currentTimeMillis() + 5 * 60 * 1000))
    .signWith(Keys.hmacShaKeyFor(secretKey.getBytes(StandardCharsets.UTF_8)))
.compact();Node.js:
const jwt = require('jsonwebtoken');

const token = jwt.sign({
    username: 'zhang_san',
    user_id: 'SYS_USER_001',
    nickname: '张三',
    email: 'zhangsan@example.com',
    source: 'your_app'
}, 'your_shared_secret_key', {
    algorithm: 'HS256',
    expiresIn: '5m'  // Expires in 5 minutes
});
⚠️ In production, Token generation must happen on the backend; the shared secret must never appear in frontend code.
15.6 Building the Login URL and Redirecting
Construct the URL:
{OntiCards API URL}/sso/login?token={JWT Token}&redirect_url={callback URL}Example:
https://api.onticards.com/sso/login?token=eyJhbGciOiJIUzI1NiIsInR5cCI6IkpXVCJ9...&redirect_url=https://frontend.onticards.com/overviewRedirect code (execute the redirect after generating the token; direct redirect is recommended):
const ssoUrl = `${API_BASE}/sso/login?token=${encodeURIComponent(token)}&redirect_url=${encodeURIComponent(FRONTEND_URL)}`;
window.location.href = ssoUrl;
15.7 Receiving the Token via Callback
After a successful login, the browser is redirected to:
https://frontend.onticards.com/overview?access_token=eyJhbGciOiJIUzI1NiIsInR5cCI6IkpXVCJ9...Frontend code to receive the token:
// Read access_token from the URL
function getAccessToken() {
    return new URLSearchParams(window.location.search).get('access_token');
}

const token = getAccessToken();
if (token) {
    localStorage.setItem('access_token', token);
    // Clean the token from the URL (avoid token leakage in browser history)
    window.history.replaceState({}, document.title, window.location.pathname);
}

// Carry the Token in the header for subsequent API requests
fetch('/api/your-endpoint', {
    headers: { 'Authorization': 'Bearer ' + localStorage.getItem('access_token') }
});
15.8 Error Codes
| HTTP status | error field | Reason |
|---|---|---|
| 400 | 缺少token参数 | No token was passed in the URL |
| 400 | token中缺少必要的用户信息 | username or user_id is empty in the Payload |
| 401 | token已过期 | The exp of the Token has passed |
| 401 | token无效 | Signature verification failed (mismatched secret or tampered content) |
15.9 Testing and Verification
Local test pages:
- SSO test center:
http://localhost:9103/static/sso_test.html
- Callback test page:
http://localhost:9103/static/sso_callback.html
Integration checklist:
- [ ] Generate a JWT Token (verify the three-part structure: Header.Payload.Signature)
- [ ] The Payload contains the required fields: username, user_id, exp
- [ ] The Token is signed with the HS256 algorithm
- [ ] Build the SSO login URL and test the redirect flow
- [ ] Verify the callback page receives access_token
- [ ] Confirm the Token validity period (5 minutes is recommended)
- [ ] Use a strong secret in production; do not use the example secret
16. Frequently Asked Questions (FAQ)
Q1: I don't see any data sources after logging in?
Causes:
- You are a new user and have not added any data sources yet
- Or the administrator has not granted access yet
Fix:
- Click Add New Data Source in the Workspace
- Or contact the administrator for access
Q2: Data card generation is slow?
Causes:
- The data source has many tables
- Many fields
- Slow LLM responses
Suggestions:
- Wait for the system to finish asynchronously (check progress in the Tasks tab)
- Switch the chat model to a faster one
- Large tables can be refreshed in batches
Q3: Query results are inaccurate?
Check the following in order:
- Data card quality: are the table and field descriptions accurate?
- Business glossary: is the business concept in your question defined?
- Data discovery: have the relationships between tables been discovered?
- Question phrasing: is it specific enough?
- Review the "Query explanation": how did the system understand your question?
Q4: Some conditions were ignored?
The system could not recognize certain conditions in the current database during parsing. It will:
- Execute the conditions it can recognize
- Clearly mark the "ignored conditions" and the reasons in the results
- Tell you how to supplement them (e.g. enrich the data card)
Q5: Queries are slow?
Suggestions:
- Add a time range
- Add necessary filters
- Avoid querying too much data at once
- Ask your DBA to optimize the indexes of the relevant tables
Q6: Token consumption is high?
Suggestions:
- Simplify the question description
- Reduce unnecessary conversation history
- Switch to a smaller, faster model
- Adjust in System & Account → Model Configuration
Q7: An API Key has been leaked — what should I do?
Handle immediately:
- Disable the key in API Keys
- Create a new key
- Update all consumers
- Check the Audit Logs for any abnormal calls
Q8: I want to add a new database type?
- The databases supported by the open-source edition are listed in §3.3
- The commercial edition supports additional customized databases
- Submit a Feature Request
17. Getting Help
Documentation
| Document | Link |
|---|---|
| Quick start | first-time usage flow |
| Deployment guide | Deployment Guide |
| API reference | API Reference |
| FAQ | FAQ |
| Troubleshooting | Troubleshooting |
| Changelog | changelog |
Online Resources
- GitHub Issues: submit bugs or feature requests
- Product website:
- Tech blog:
- Community forum: scan the QR code to join the user group
Commercial Support
For enterprise-grade support, custom development, private deployment, row/column-level permissions, SSO enhancements, and other advanced capabilities, contact the commercial team.
🎯 Next steps: first-time usage flow · API Reference · Troubleshooting Guide
Last updated: August 2026