The Academic Data Intelligence Cube: Making University Data Computable, Queryable, and Actionable
After integrating data from academic affairs, student services, and research systems across multiple campuses, a university compressed multi-day reporting cycles into minutes with natural-language querying and automated report generation—giving faculty and administrators conversational data access for the first time.
A multi-campus university generates vast amounts of data across its daily operations. From course scheduling and student grades to research funding and laboratory equipment, the data is abundant yet remains largely inaccessible. When management needs a cross-departmental statistical report, they typically spend days coordinating multiple offices and reconciling inconsistent definitions. Faculty members who want a quick overview of a class's academic distribution are limited to a handful of pre-built reports with no flexibility. Following a systematic data-governance and intelligent-platform initiative, the university achieved natural-language querying and automated report generation, reducing key data queries from an average of 2–3 days to minute-level response times.
Background and Pain Points
The complexity of university data governance stems from multi-source heterogeneity. The institution's academic system, student-services platform, research-management system, and library database were built by different vendors, each with distinct data formats, field definitions, and update frequencies. Four core pain points persisted:
Data silos with no unified aggregation. Each business system operated as an isolated information island. Student enrollment data lived in the academic system, disciplinary records in student services, and research outputs in yet another database. Cross-system correlation required heavy manual exporting and Excel stitching—inefficient and error-prone.
Lack of data standards and inconsistent definitions. The same metric was defined differently across systems. For example, "enrolled student count" was based on registered学籍 in academic affairs, on payment status in finance, and on课题 participation in research management. Without a metadata-management system, every cross-department report required repeated definition checks.
High barrier to querying tools for non-technical users. Traditional BI dashboards, while powerful, carried steep learning curves for ordinary faculty and staff. Requesting a new report meant filing a ticket, waiting for development, and enduring cycles measured in weeks.
Insufficient professional analytics for business scenarios. Years of historical data sat untapped. Teaching evaluation, student profiling, and research-trend analysis remained beyond reach. Data analysis stayed at simple aggregation, offering little support for management decisions.
What We Did
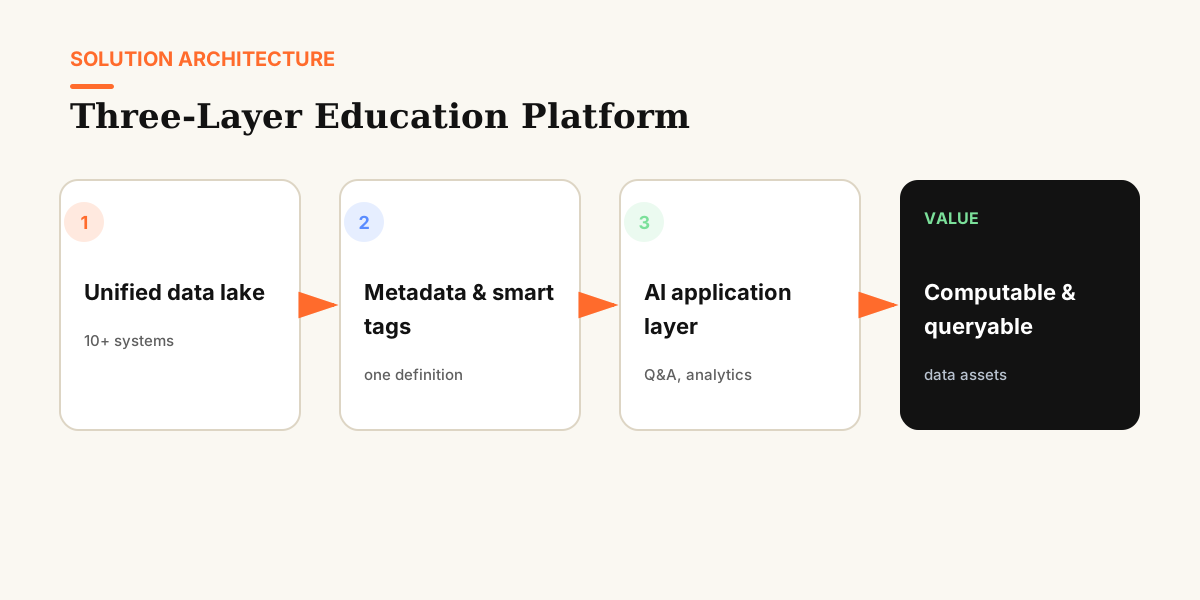
The project team partnered with the university's IT department to build an educational data intelligence platform around a three-layer architecture: data collection, storage management, and AI application.
Step 1: Build an integrated educational database. The team mapped data interfaces across more than ten core business systems and established unified ingestion standards. Through a combination of incremental sync and full verification, academic, student-services, research, HR, and facilities data were consolidated into a single educational database, enabling cross-system connectivity.
Step 2: Establish metadata governance and intelligent tagging. On top of data integration, the team created standardized metadata definitions covering business meaning, source system, refresh frequency, and responsible department. An AI analytics engine then auto-generated multidimensional tags for students and faculty—such as academic-performance tiers, interest domains, and research engagement—transforming static records into dynamic profiles.
Step 3: Deploy an intelligent natural-language query platform. The platform's underlying semantic layer translates business language into data queries. Faculty or administrators can ask questions in everyday language, such as "Which three courses had the highest failure rates this semester?" or "What is the five-year trend of National Natural Science Foundation approvals?" The system automatically parses intent, matches data cards, and returns results—no SQL or BI skills required.
Step 4: Enable intelligent visualization and report generation. Query results appear as tables but can be switched with one click to bar charts, trend lines, heatmaps, and more. The platform also supports intelligent report generation, automatically producing structured outputs like annual teaching-quality analyses, discipline-assessment reports, and comprehensive student profiles—greatly reducing the administrative burden of manual data compilation.
Step 5: Construct an educational knowledge graph and holistic profiles. Above the data-card layer, the team built a knowledge graph linking disciplines, courses, faculty, and research outputs. This network helps administrators visualize interdisciplinary intersections and resource allocation while powering student recommendations and curriculum-optimization decisions. The comprehensive educational profiles provide a multidimensional view of students and faculty.
Results on the Ground
After launch, the platform delivered measurable improvements in query efficiency, reporting speed, and decision support:
- Natural-language query response dropped from 2–3 days to minutes. Complex queries that once required cross-department coordination and manual calculation can now be completed through a conversational interface.
- Periodic management-report generation improved by roughly 80%. End-of-semester teaching-quality reports and annual discipline assessments that previously required 1–2 weeks of centralized development are now auto-generated from templates, needing only human review and light editing.
- Data-definition consistency improved markedly. With metadata governance in place, version confusion around key institutional metrics dropped significantly, lowering communication costs in cross-department collaboration.
- Self-service data usage among faculty and administrators rose sharply. Over 70% of active users came from non-technical business units, achieving genuine "data democratization."
Lessons Learned: From Project to OntiCards
This project reinforced a key insight: the bottleneck in university data intelligence is rarely algorithmic capability; it is data connectivity and semantic consistency. Even the most powerful analytics model will produce misleadingly polished reports if fed inconsistently defined, poorly understood raw data.
The core lessons—unifying multi-source data through a common data foundation, ensuring consistent definitions via metadata governance, and enabling natural-language querying through a semantic layer—later shaped OntiCards' "data-card layer" design. In OntiCards, every data card carries its own business semantics, field definitions, and relationship mappings. When an Agent queries data, it no longer faces cold physical tables; it directly understands business objects like "student," "course," and "research output" and their relationships. This business-oriented semantic-layer design is the critical foundation that lets large language models "speak human and calculate correctly" in institutional settings.
If your institution faces data silos, high query barriers, and slow report production, OntiCards' data cards and query Agent capabilities may offer a low-barrier upgrade path. Reach out at hello@onticards.com or visit our product page to learn more.