Making Data Speak: How OntiCards Built a Four-Layer Architecture
Upgrading data from 'fields lying in a warehouse' to 'knowledge assets business teams can directly ask about.' Here is how we decomposed that problem.
Why OntiCards Exists
Working with enterprise after enterprise, we kept hearing the same line: "We have so much data, but nobody can actually use it."
Hundreds of BI dashboards piled up. Analysts burned out writing SQL. Business teams queued three days for a single number. The root cause was never a tool shortage — it was that data was never truly understood. It lived inside schemas, inside field names, inside engineers' heads, with an entire technical layer separating it from the business side.
What we built OntiCards to solve is exactly this: elevate data from "fields" to "knowledge that can be asked, retrieved, and reused" — so business people can talk to their data in plain language, without finding a person first.
The Four-Layer Architecture
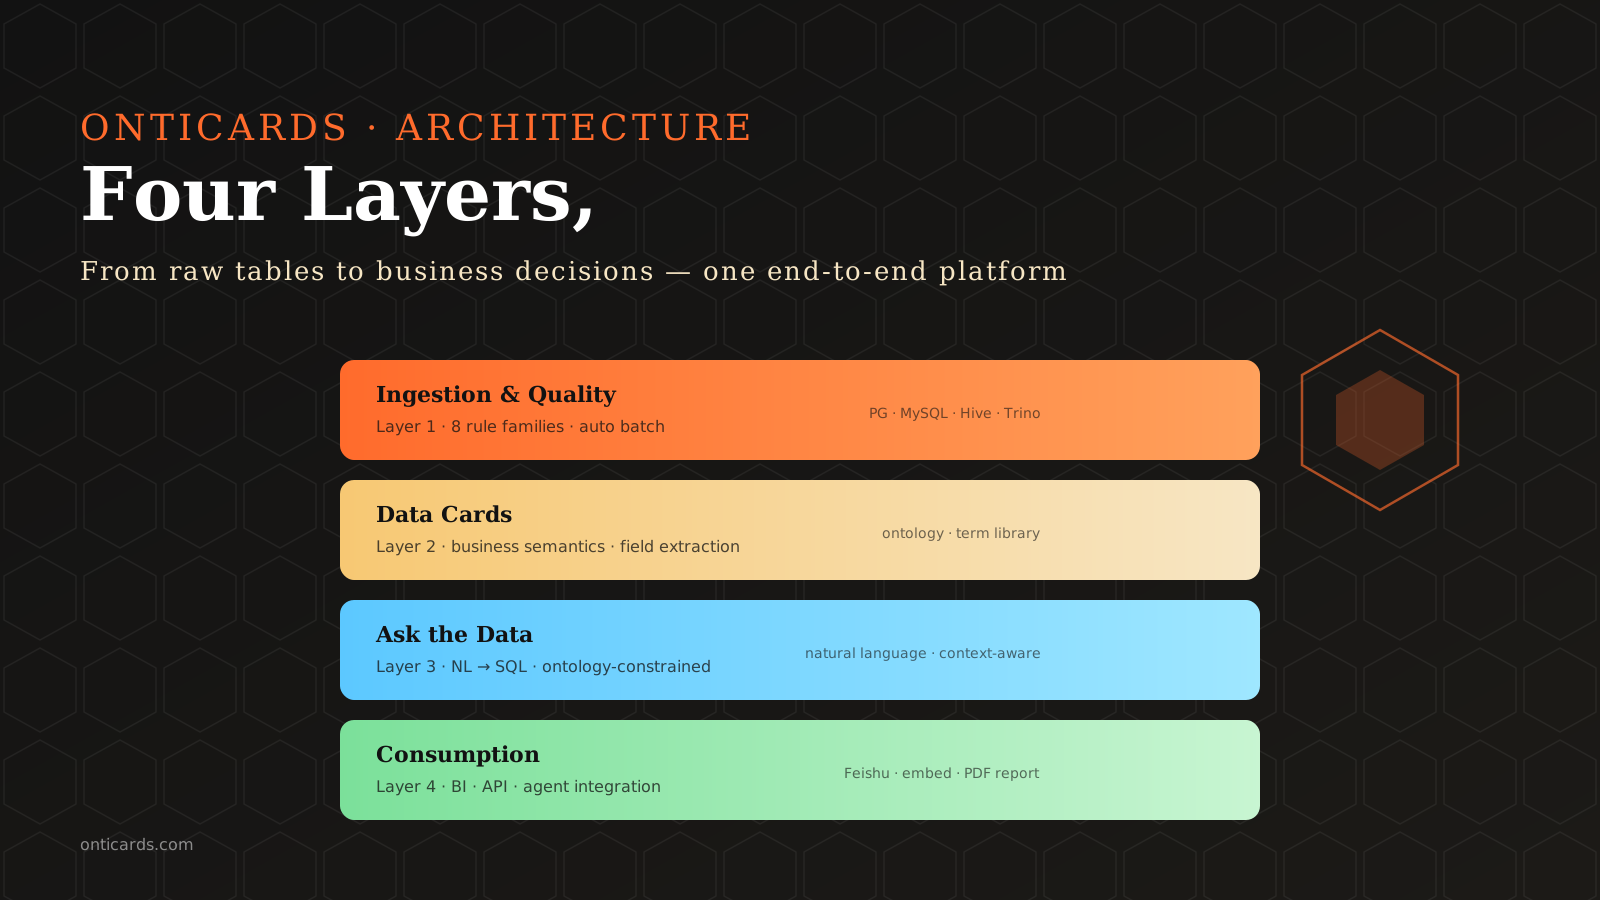
OntiCards is not a wrapper around an LLM. It's a data-agent platform with clearly separated layers:
┌─────────────────────────────────────────┐
│  Layer 4 — Data Consumption              │
│  BI Integration / AI Agents / API        │
├─────────────────────────────────────────┤
│  Layer 3 — Intelligent Q&A               │
│  Card-driven natural-language queries    │
├─────────────────────────────────────────┤
│  Layer 2 — Data Cards                    │
│  Ontology modeling · Glossary · Entities │
├─────────────────────────────────────────┤
│  Layer 1 — Ingestion & Quality           │
│  Multi-source connection · Profiling · QA│
└─────────────────────────────────────────┘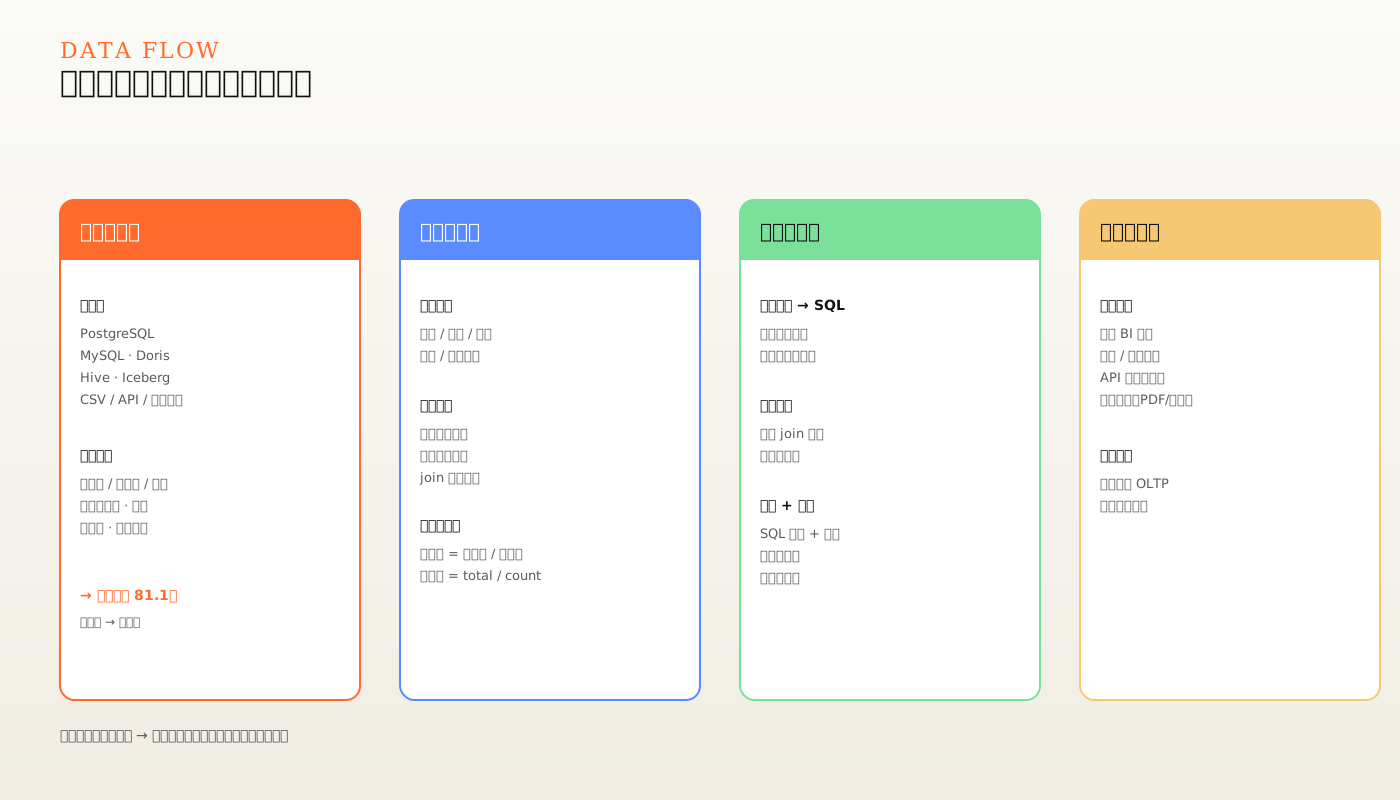
Layer 1: Bring data in, and tell us whether it's clean
We connect to nine mainstream databases (PostgreSQL, MySQL, Oracle, SQL Server, Trino, SQLite, KingBase, OceanBase, DM), automatically profile the schema, then run a quality check: ID format, name consistency, numeric ranges, foreign-key integrity. We tell you exactly where the dirt is and why.
The goal of this layer isn't to "fix" data (that's a separate slow track) — it's to make visible what's there, which fields are usable, and which rules were triggered. A quality score of 81.1 or 100.0 should be transparent, not a black box.
Layer 2: Turn fields into data cards
Fields are a technical view; business terms are a business view. Both are isolated.
Our approach bridges them in the middle: for every table we generate a data card containing both the technical fields and the business descriptions and example questions. A column called id_card_name shows up in a card that explains: "This is the name on the customer's ID card; typically compared against customer_name for consistency; commonly used to answer questions about KYC and risk scoring."
A separate layer — the business glossary (industry templates) — attaches business vocabulary to these cards: finance, e-commerce, chemicals, manufacturing, each with its own jargon. So when you ask about "revenue," "cash flow," or "GMV," the system knows what you mean in that context.
Layer 3: Query data with natural language
This is the layer users feel most directly. Everything built before makes this layer possible:
- Pick a data card (which scopes the question)
- Ask in natural language
- The system generates SQL, runs the query, replies in human language
This layer is also the easiest to fake. Three failure modes we've all hit:
- Schema too big, model picks the wrong column → pre-filter via data cards
- Business word doesn't map to field name → intent recognition via glossary
- Multi-table joins go wrong → constrain join paths via ontology
Layer 4: Send the answers out
Data ultimately has to flow back into business systems: BI dashboards, automated reports, AI agents, APIs, subscriptions. We've kept this layer thin on purpose — OntiCards isn't a closed BI tool, it's the substrate for data intelligence. What you build on top is your call.
How This Differs from Traditional BI
| Dimension | Traditional BI | OntiCards |
|---|---|---|
| Who asks questions | data analysts | business users |
| How they ask | drag-drop / SQL | natural language |
| Data view | columns | business entities |
| Quality visibility | sampled reports | full-table checks + rule library |
| Up/downstream | dashboards | dashboards + API + agents |
What We Want OntiCards to Become
Not a bigger BI tool — a middle layer where data gets understood.
We want business people to receive not dashboards, but a queryable, searchable, reusable data world. We want the tacit knowledge inside an enterprise to be preserved, and continue serving the next decade.
That's the reason OntiCards exists. It's what we work on every day.