From Teachers Burning Midnight Oil to AI-Generated Student Reports
A school academic-affairs department serving several thousand students transformed its end-of-term comprehensive reporting from manual teacher drafting to automated generation using an LLM and multi-Agent architecture—boosting output efficiency by over 80%.
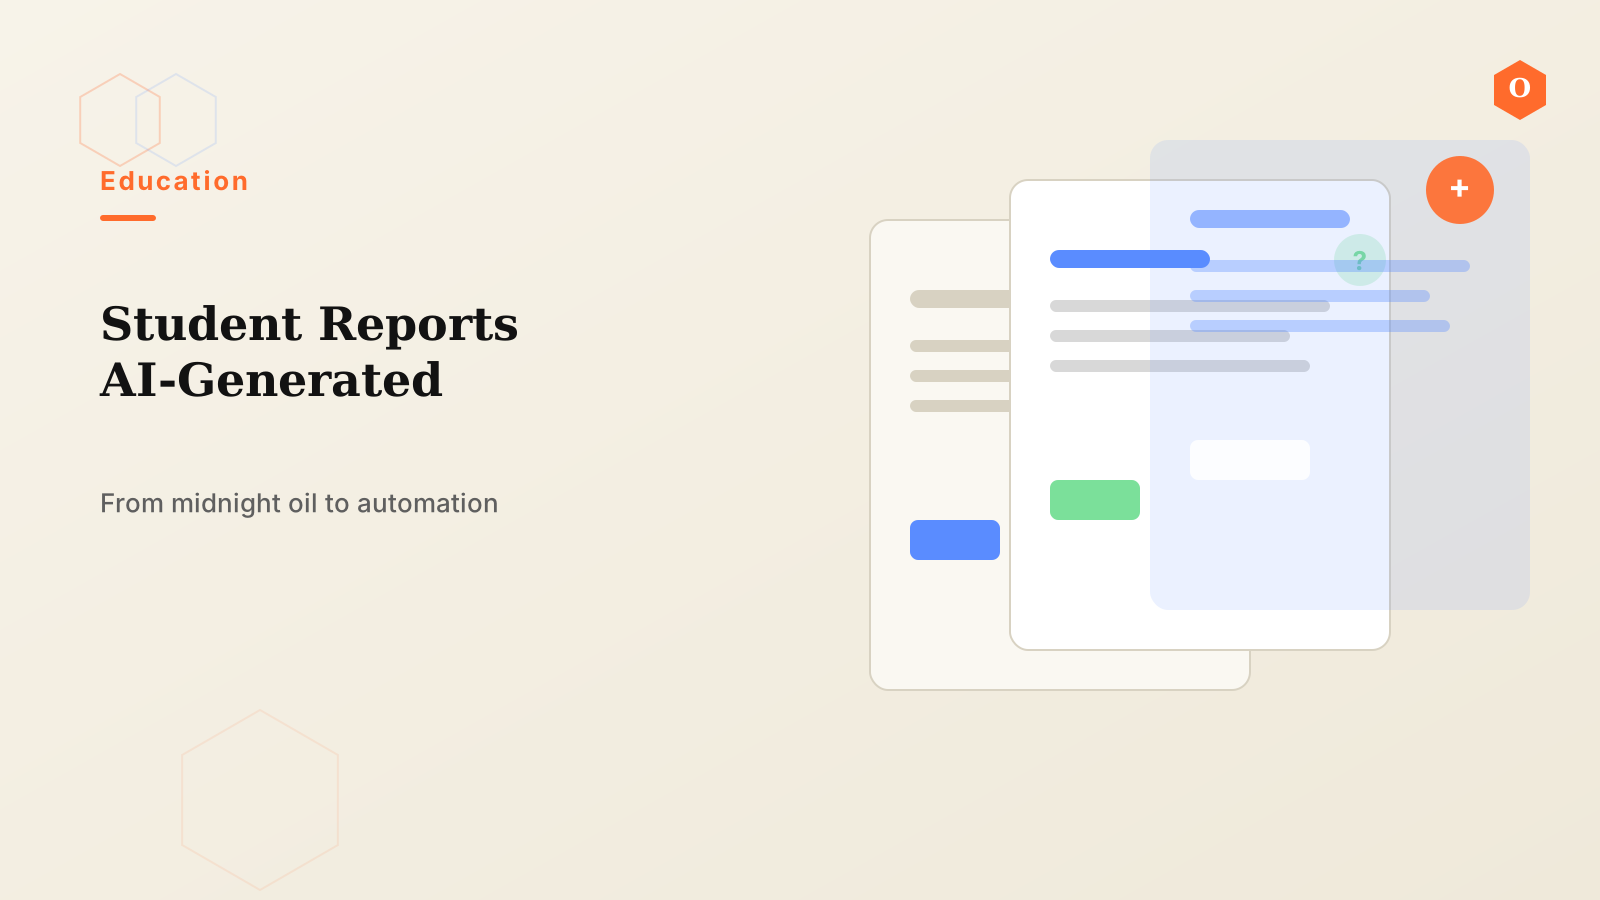
At the end of every semester, writing comprehensive student reports is one of the heaviest administrative burdens on teachers. For a school serving several thousand students, this means hundreds of faculty members must individually draft or input each student's semester performance, interests and strengths, weakness analysis, and development recommendations within a tight deadline. The data is scattered across grade systems, attendance records, activity archives, and daily teacher observation notes. Teachers must search across systems, compile information manually, and then transform it into coherent narrative text—a time-consuming, labor-intensive process prone to fatigue-driven homogenization and omissions. After introducing an intelligent reporting system built on large language models and a multi-Agent collaborative architecture, the school boosted report-generation efficiency by more than 80%, freeing teachers to devote more time to instruction.
Background and Pain Points
The traditional student comprehensive-report workflow suffers from three deep-rooted problems:
Severe data silos and heavy manual compilation. Student academic grades live in the academic system, attendance and behavioral records in student-services platforms, and club activities and competition awards in various activity archives. To write reports, teachers must manually extract information from multiple sources and organize it prose by prose. For a teacher instructing multiple classes, this means repeating the same labor hundreds of times.
Unstructured data resist conversion into analytical information. Beyond standardized test scores, a wealth of valuable information—such as classroom engagement, teamwork performance, and creative-thinking tendencies—exists in unstructured form within teachers' daily observation notes and comments. Without unified cleansing and modeling, this data is hard to systematically incorporate into holistic assessments.
Report quality is constrained by time and individual experience. Faced with report deadlines, teachers often complete massive volumes of writing in compressed timeframes, causing content to drift toward templated formats that fail to reflect each student's individual characteristics. Meanwhile, differing understandings of educational assessment standards and writing styles among teachers make consistency and professionalism difficult to guarantee.
What We Did
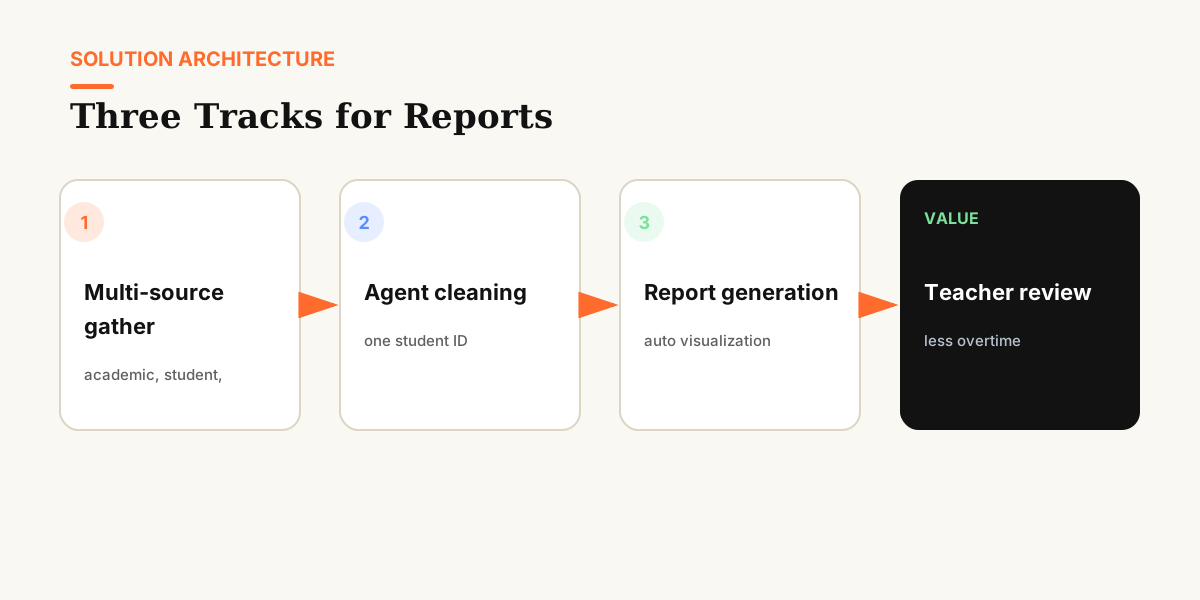
The project team worked closely with the school's academic-affairs office to build a student-analysis and visual-report generation system along three core threads: data integration, intelligent governance, and analytical generation.
Step 1: Aggregate multi-source student-record data. The team connected the school's academic system, student-services platform, activity-management system, and teacher observation archive. Structured scores, attendance, and disciplinary records were ingested alongside unstructured teacher comments and activity descriptions into a unified data platform. By establishing a unique student identifier, cross-system data were automatically correlated, eliminating the need for teachers to search and stitch manually.
Step 2: Agent collaboration for data extraction and cleansing. The system employs a multi-Agent architecture in which different Agents handle specific tasks: an extraction Agent pulls key fields from source documents; a cleansing Agent standardizes formats, fills missing values, and removes redundancies; and an analysis Agent performs semantic understanding on unstructured text to identify behavioral patterns, interest tendencies, and capability profiles. The entire pipeline runs automatically, drastically reducing manual intervention.
Step 3: Integrate an expert knowledge graph to standardize evaluation logic. The team built an expert knowledge graph from professional educational knowledge—such as core competency frameworks, student-development evaluation standards, and career-planning theory—and bound it to the student data model. This ensures that when the system generates evaluation conclusions, it references validated educational theory rather than relying solely on statistical patterns, guaranteeing professional reliability.
Step 4: Multidimensional assessment and personalized development recommendations. Based on governed data, the system evaluates students across multiple dimensions including academic performance, interests and strengths, and weakness analysis. Drawing on educational theory from the knowledge graph, it automatically generates personalized support measures and career-planning recommendations—for example, suggesting debate clubs or speech training for students with strong logical thinking but room to grow in expression, and recommending relevant competitions and advancement pathways for those with notable artistic talents.
Step 5: Auto-generate data visualizations and comprehensive reports. The system converts assessment results into clear data charts—including academic trend curves, capability radar maps, and interest-distribution heatmaps—and integrates them into a structured semester comprehensive report. Written in natural narrative prose, the report requires only teacher review and light editing before finalization.
Results on the Ground
The system completed a full-semester pilot, delivering measurable improvements in efficiency, quality, and teacher satisfaction:
- Report-writing efficiency rose by over 80%. A teacher who previously spent 8–10 hours writing 40 reports for one class now receives auto-generated drafts and needs only 1–2 hours for review and revision.
- Report consistency improved markedly. With the expert knowledge graph in place, reports from different teachers converged in evaluation framework, terminology, and logical structure. School management noted significantly enhanced comparability across classes and grade levels.
- Personalization increased rather than decreased. Because the system can identify fine-grained characteristics from vast unstructured data, the sections on student interests, strengths, and development recommendations became more specific than in hand-written reports. Parents commented that the reports were "easy to understand and highly targeted."
- Teacher job satisfaction rose. A survey showed over 90% of participating teachers felt the system effectively reduced end-of-term administrative load, giving them more time for lesson preparation and student mentoring.
Lessons Learned: From Project to OntiCards
The central insight from this project is that generative AI's value in education lies not only in writing fast, but in writing correctly. Student reports involve growth evaluation, psychological description, and career guidance, demanding high accuracy and professionalism. Relying solely on a general-purpose large model to improvise can easily produce biased wording or inappropriate recommendations.
The project's solution—using Agent collaboration for the full data pipeline, anchoring professional standards with an expert knowledge graph, and generating structured reports through multidimensional models—was later refined into OntiCards' "data card + professional Agent" paradigm. In OntiCards, every educational assessment object (student, course, faculty development, etc.) can be defined as a data card carrying professional semantics. When an Agent generates a report or answers a question, it actively invokes the knowledge constraints and quality gates embedded in the card, ensuring outputs that are both efficient and reliable.
If your school or educational institution is also struggling with the efficiency and quality of student assessment reports, teacher evaluations, or course analysis, we invite you to explore OntiCards' solutions for education or contact us at hello@onticards.com to discuss implementation.