How a Bank's Data Assets Went from 'Databases Only Engineers Can Read' to 'Numbers Any Colleague Can Ask For'
Delivered on the OntiCards data semantic layer and agent platform: obscure schemas are translated into business-readable DataCards, and natural-language queries auto-generate SQL and charts. AI output achieved an 85% adoption rate in 2 hours — comparable to an expert's 8-hour output — a 4x efficiency gain.
From "Databases Only Engineers Can Read" to "Numbers Anyone Can Ask For"
A provincial legal-person bank in Southwest China is turning "data assets" from a noun into a verb. In the past, if a business colleague wanted to analyze "this month's growth structure of retail deposits," they had to queue a request with the data team — what the fields meant and how metrics were defined was all buried in a database dictionary nobody understood. Today, the same question can be asked directly in natural language: the system auto-generates executable SQL, recommends the right chart type, and keeps every step traceable.
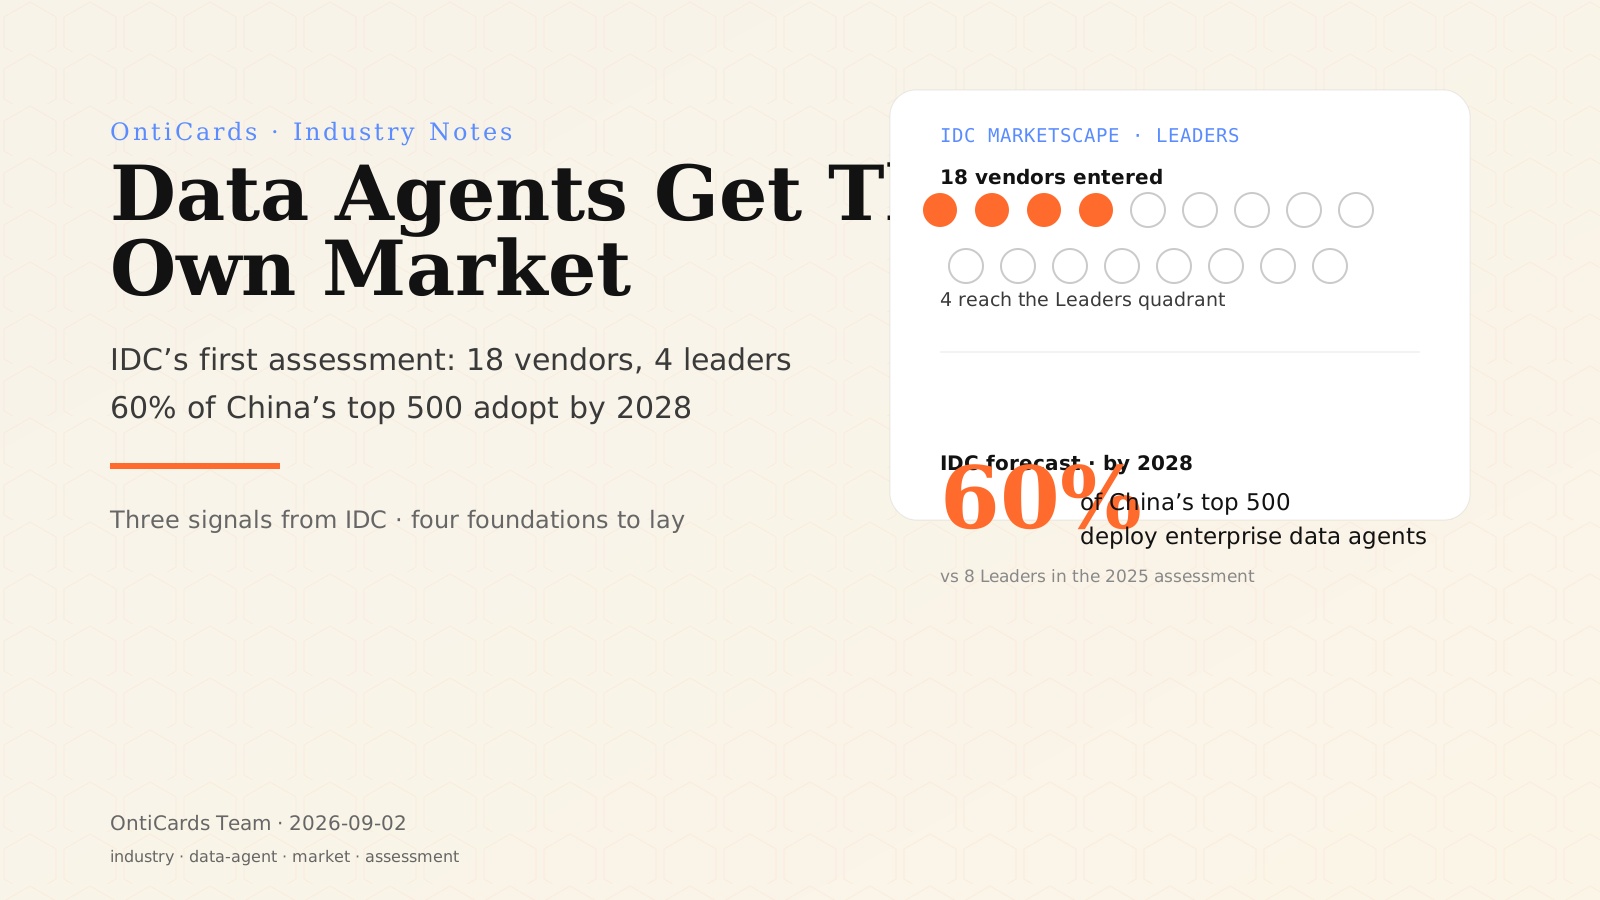
This capability was delivered on the OntiCards data semantic layer and agent platform. The validation results were compelling: AI output produced in 2 hours achieved an 85% adoption rate, on par with the 90% adoption of an expert's 8-hour output — roughly a 4x efficiency gain. In other words, analysis delivery was dramatically compressed without compromising quality.
Background and Pain Points
The bank faced four typical obstacles in making data assets usable by the business.
First, data assets were hard for the business to understand. Field meanings were opaque to business users. With dozens of tables and thousands of fields in the database, a business colleague could not tell what "cust_level" meant, or whether it was the same thing as "customer tier" — data and business scenarios were severely disconnected.
Second, the analysis response chain was too long. Every business request had to go through manual support from the data team: request, queue, develop, verify, deliver. An analysis often took days — slow responses and low efficiency dragged down the pace of business innovation.
Third, BI tools had a steep learning curve. Non-technical users could not complete analyses on their own. Dragging dimensions, configuring filters, understanding metric definitions — every step was a barrier. There was no bridge from "business intent" to "BI operation."
Fourth, data quality was not assured. Analysis conclusions lacked an end-to-end quality-check mechanism for credibility and compliance, so the business hesitated to make decisions based on AI-generated analysis.
These problems are highly prevalent across banking. Data assets keep growing, but few are "understandable and usable." Large models keep getting stronger, but asking them to "read the database and write SQL" directly produces results that are unstable and uncontrollable.
What We Did
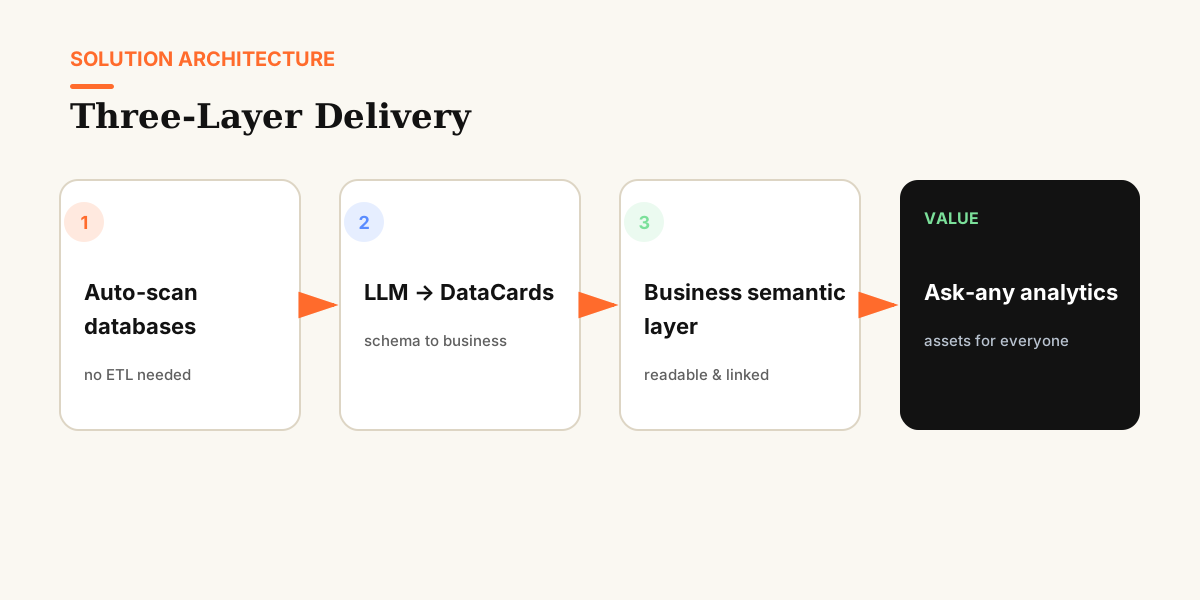
The project delivered a "three-layer converged" solution built on the OntiCards data semantic layer plus an agent platform.
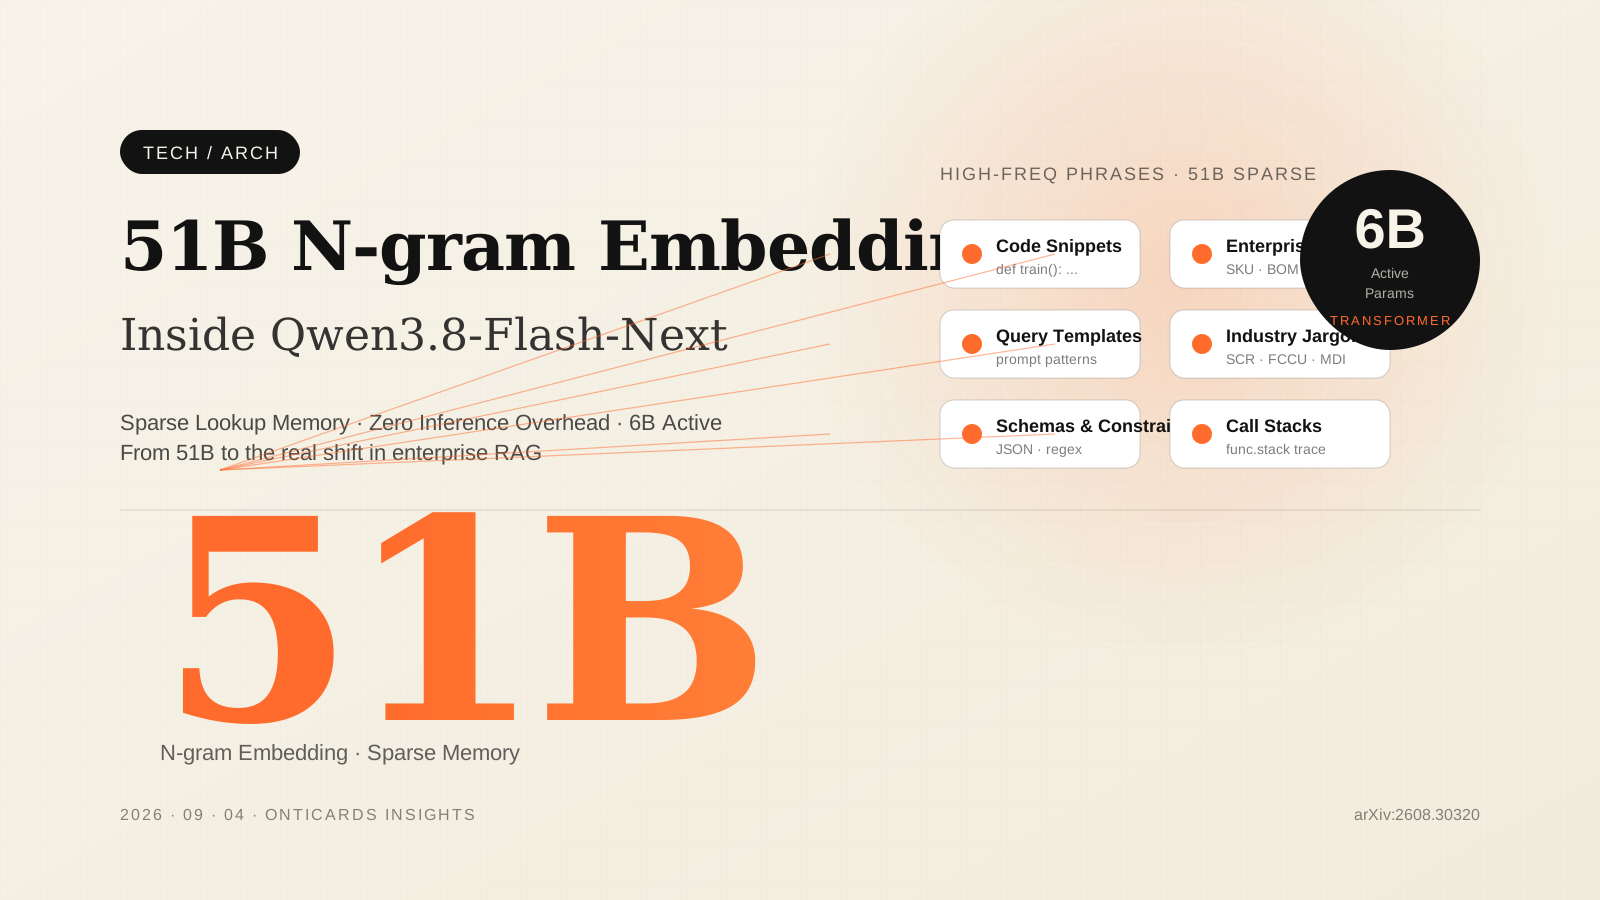
Layer 1: the OntiCards data semantic layer (the core foundation). It automatically scans business databases, and a large model converts obscure table schemas into business-readable DataCards — annotating field meanings, typical values, and cross-table relationships — stored in a vector database as the reasoning foundation for natural-language analytics. Business users no longer see cryptic fields like "cust_level" but readable descriptions like "customer tier (high/medium/low, from the customer segmentation model)." No ETL is required, and data assets go from "readable only by engineers" to "usable by everyone."
Layer 2: a dual-knowledge-base system. The first is a business scenario knowledge base, capturing analysis conventions and metric definitions; the second is a BI operation knowledge base, capturing platform operating steps. The agent platform intelligently links and fuses the two, precisely matching business intent to BI operation instructions — when a user asks a business question, the system knows which metric to use and which analysis path to follow.
Layer 3: an intelligent service layer. It delivers an end-to-end chain — natural language → intent recognition → knowledge retrieval → analysis plan → step-by-step BI guidance — auto-generating executable SQL, recommending chart types intelligently, and keeping the process transparent and traceable. Users get both the data conclusion and visibility into how each step was computed.
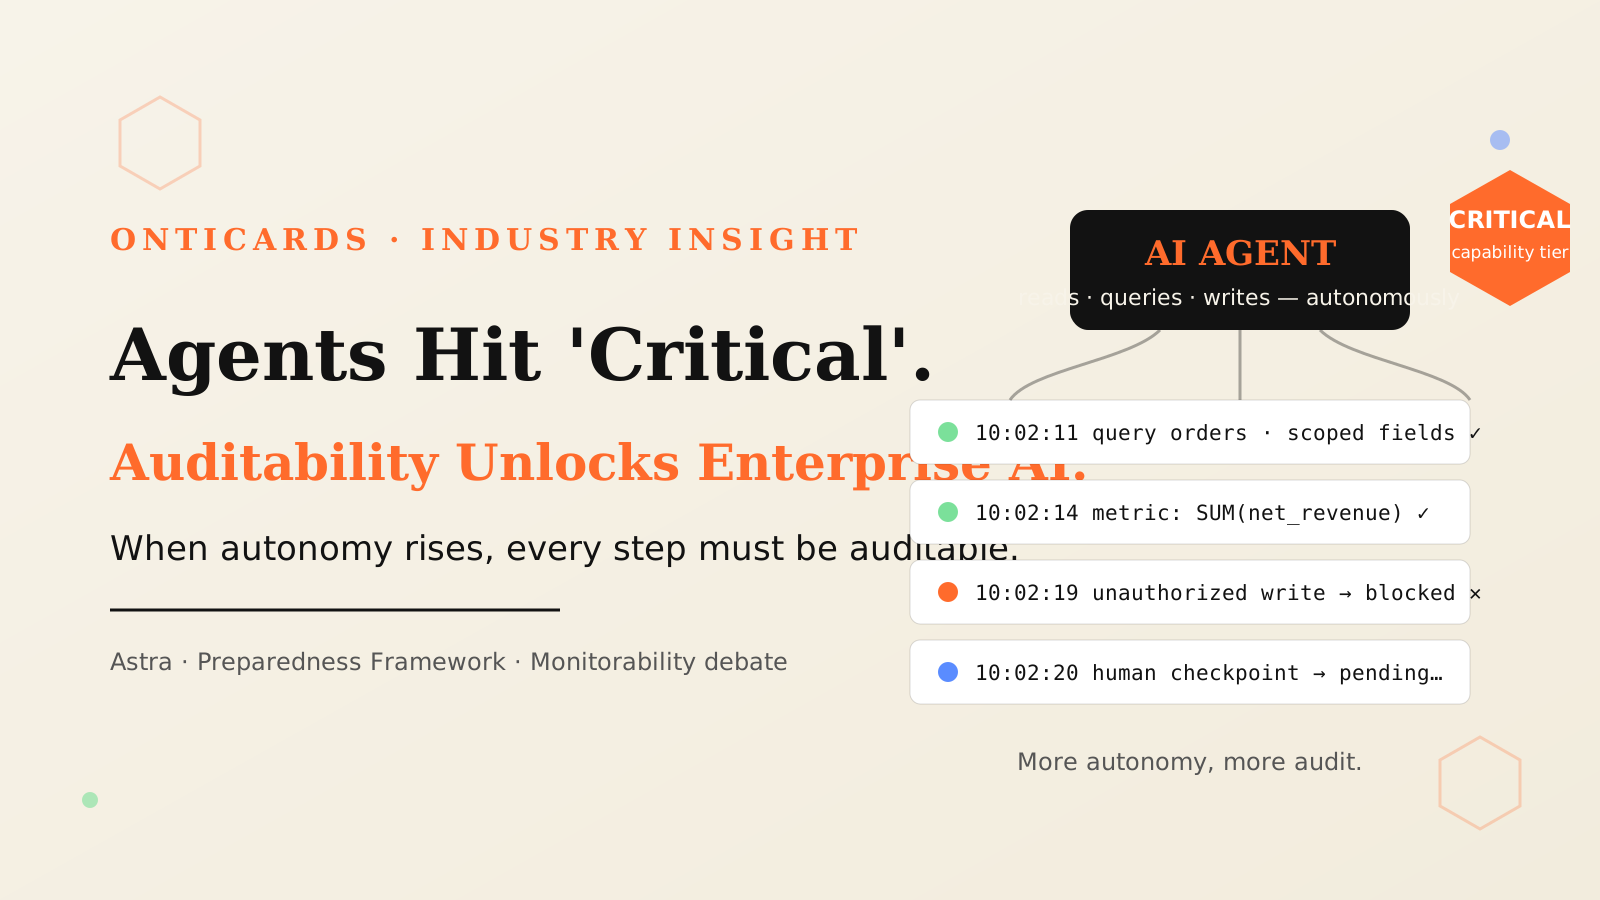
On top of this, the project designed three layers of quality guardrails: automatic field-existence validation to stop "asking for a metric that doesn't exist" at the source; mandatory human review before knowledge is ingested, so every semantic description entering the system has been vetted; and answer output strictly limited to the approved knowledge base, ensuring outputs are credible, usable, controllable, and auditable. The system also never connects directly to production databases — the analysis chain is isolated from the production environment, protecting data security and compliance at the architectural level.
Results
- Data assets activated: OntiCards automatically converts obscure schemas into business-readable DataCards, changing data assets from "readable only by engineers" to "usable by everyone."
- 4x efficiency gain: AI output in 2 hours achieved an 85% adoption rate, on par with an expert's 8-hour output (90% adoption) — much faster delivery without sacrificing quality.
- Natural-language analytics: business users ask directly, and the system auto-generates precise SQL and recommends visualizations — no BI tool skills required.
- End-to-end analytics guidance: full step-by-step guidance from business question to BI operation dramatically lowers the barrier to analysis tools.
- Compliance and security: no direct connection to production databases, and three layers of quality guardrails keep outputs compliant and auditable.
For a bank, the value of this solution goes beyond "faster data retrieval." It transforms years of accumulated data assets into real business productivity — data teams are freed from repetitive data pulls, and business users feel, for the first time, that "data is close to me."
Lessons Learned: From Project to OntiCards
This project is OntiCards' direct practice of the data semantic layer in financial services — standardizing and productizing the chain of "database schema → business-readable semantics → trustworthy analytics." Three core lessons came out of it.
First, a semantic layer must be read by the business, not by engineers. Every sentence in a DataCard must be comprehensible to business users; otherwise the semantic layer degrades into "a schema maintained a second time by the data team." Second, guardrails and knowledge are designed in layers. Field validation, human review, and output restriction form three layers that block three risk types — asking wrong, ingesting wrong, answering wrong — each necessary in sequence. Third, "never connect to production directly" is the bottom line in financial scenarios. Analytics capability can be strong, but the data boundary must be clear.
These lessons became OntiCards' solution for the financial industry. For a fuller architectural view, see the OntiCards four-layer architecture (ingestion, cards, analytics, consumption — decoupled) and our thinking on the data semantic layer. At the industry level, Gartner already positions the semantic layer as a key component for the future of analytics and AI, and NL2SQL benchmarks like Spider 2.0 that approximate real enterprise environments show the same thing: without semantic-layer governance, the "model writes SQL directly" route does not go far.