Highway Network Monitoring: From 'Watching Screens' to 'AI Proactive Alerting'
A provincial transportation investment group in western China with over 6,000 km of operated highways turned thousands of surveillance feeds into perceivable, analyzable, traceable data with a multimodal vision approach — 7 camera fault categories, 8 anomaly event categories, recognition accuracy of no less than 85%, and first-response time under 5 seconds for report generation and Q&A agents.
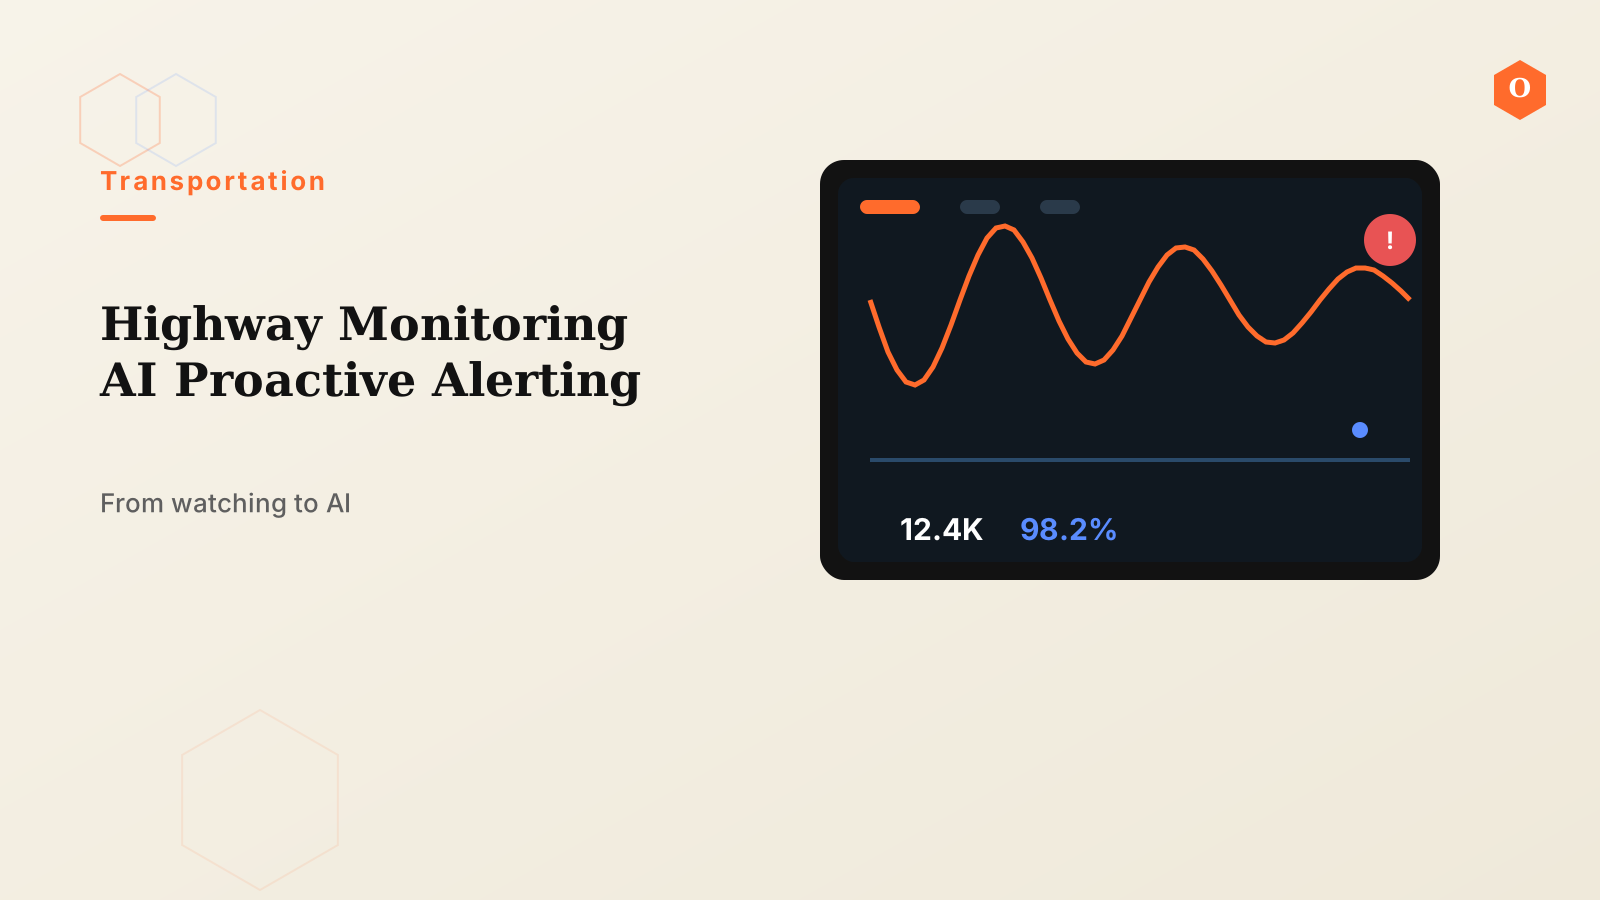
A provincial transportation investment group in western China, operating more than 6,000 km of expressways, is turning its "people watching screens" control room into an "AI proactive alerting" command center. In the pilot, the system automatically perceives and intelligently analyzes highway surveillance feeds: camera fault recognition covers 7 categories, anomaly event recognition covers 8 categories, recognition accuracy is no lower than 85%, and the first-response time for report generation and knowledge Q&A agents is under 5 seconds.
Background and Pain Points
Expressways are classic "data-rich, perception-poor" environments: cameras line the entire network, but the ability to truly "understand" the images has always depended on people. In the traditional model, operators stare at multi-screen splits for hours, making missed and delayed detections almost unavoidable. The larger the network, the sharper the problem — with thousands of feeds and 24/7 duty, human patrol depth and response speed hit a ceiling. Industry consensus confirms this: the national road-network traffic LLM pilot guided by the Ministry of Transport explicitly points out that traditional monitoring based on manual patrol and rule-based algorithms suffers from high miss rates, delayed response, limited detection types, and insufficient all-weather coverage.
This group's situation was even more complex. First, anomaly types far exceed imagination — from traffic accidents to natural disasters, all need to be discovered immediately and recorded in structured form. Second, cameras themselves "get sick": faults such as going offline, occlusion, and blur must be detected in time, or the sensing network develops blind spots. Third, discovery is only the first step — the follow-up disposal suggestions and incident reports must cite regulatory basis and follow unified templates; manual drafting is slow and error-prone.
What We Did
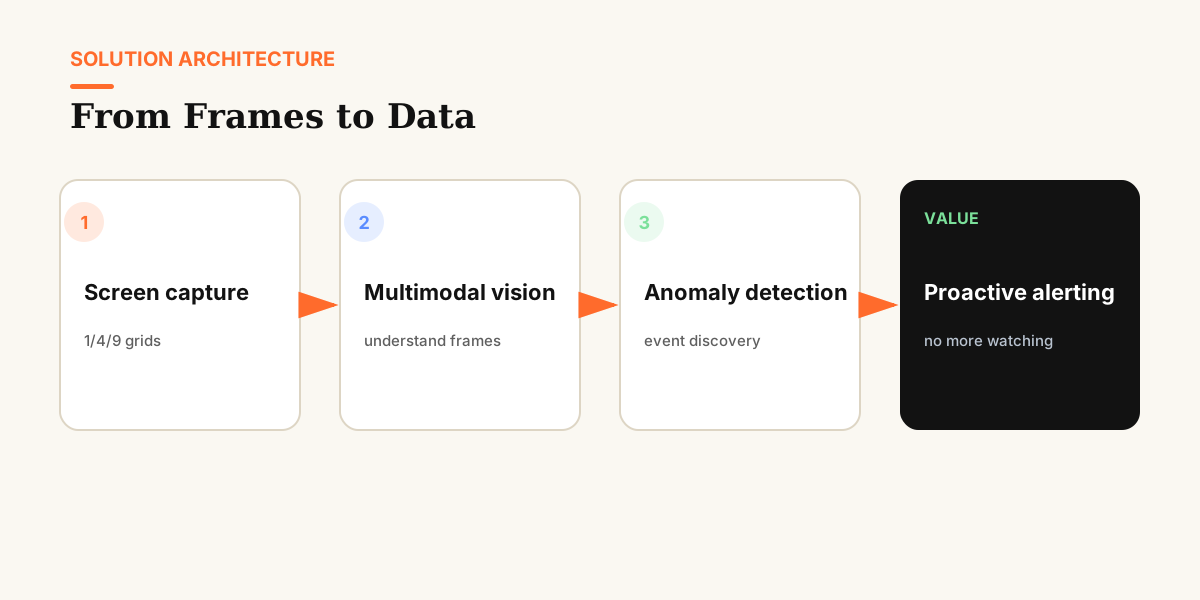
The whole solution revolved around "how images become data," with the core goal of moving perception from human eyes to models.
The first step was image capture. The project team deployed a screenshot capture tool on the monitoring terminals in the control room. It supports automatic multi-view screenshots in one-, four-, and nine-pane layouts, with customizable capture frequency and total duration — ensuring critical frames are never missed while avoiding indiscriminate, high-cost processing of every video stream.
The second step was teaching the model to "see." Screenshots are fed into AI for analysis, fusing multimodal vision models to achieve automatic perception and intelligent analysis of highway surveillance feeds. This involves two layers of recognition. First, camera fault recognition: automatically diagnosing 7 categories of faults such as going offline, occlusion, and blur, triggering real-time alerts to keep the sensing network healthy. Second, anomaly event recognition: automatically identifying 8 categories of highway anomalies such as traffic accidents and natural disasters, and outputting them as structured data — event type, location, and time enter the database directly as queryable, countable structured records.
The third step was making the data "speak." For each event category, the system generates disposal suggestions by linking internal contingency plans with external policy and regulation databases, attaching the relevant standard and regulatory basis so front-line staff know both what to do and why. Incident reports are auto-generated in Markdown format from standard templates, with online preview, download, and manual revision supported — balancing automation with human review. Finally, alerts, statistics, and reports flow into a unified dashboard with time-range filtering, visualizing the operating posture of the road network.
One point worth highlighting: the structured event data ultimately connects through OntiCards for multi-dimensional analysis. Surveillance feeds are inherently unstructured, but once extracted into structured event records, they can be cross-analyzed alongside mileage, time, weather, and maintenance records to answer questions like "which sections see the most accidents" and "when do faults concentrate."
Results
- Recognition accuracy of no less than 85%, ensuring precision in event capture.
- First-response time under 5 seconds for report generation and knowledge Q&A agents.
- Operators shifted from "staring at screens" to "reviewing and handling" alerts pushed by the system.
- Incident reports unified into standardized templates, sharply reducing archiving, tracing, and reporting costs.
- Camera faults are now perceived in real time — blind spots move from "discovered after the fact" to "alerted before they happen."
Lessons Learned: From the Project to OntiCards
The most valuable takeaway from this project is: the value of highway-network intelligence lies not in how smart any single model is, but in turning unstructured images into structured data and then connecting that data. Capture, recognition, and output are three indispensable links — and once data is structured, multi-dimensional analysis and cross-system correlation follow naturally.
These lessons have been distilled into OntiCards' solution for the smart transportation industry. Our four-layer architecture — Ingest, Cards, Ask, Consume — mirrors the common path of projects like this: first bring in multi-source data, then define business semantics, let business users query in natural language, and finally consume results across channels. If you are facing the problem of "perception data sitting unused in the warehouse," visit the OntiCards website to see how we turn surveillance, work-order, and operations data into assets that business staff can use at hand.