Natural-Language Analytics: Turning a Million-Unit Automaker's Marketing War Room into a Conversation
From a 90%+ answer rate and 85%+ accuracy in the MVP stage, to covering 14 dashboards of the marketing war room and interactive BI — a national automaker selling over a million vehicles a year turned business analytics into a conversation anyone can start.
The Marketing War Room: From Waiting for Reports to Asking Questions
A national automaker selling over a million vehicles a year has moved its marketing war room into a chat window. In the past, if management wanted to see "year-over-year sales of new-energy vehicles in East China this month," they had to file a request with the data team, wait for scheduling, and eventually receive a static report. Today, the same question can be asked directly — the system returns an answer in tens of seconds and automatically renders charts that support drill-down.
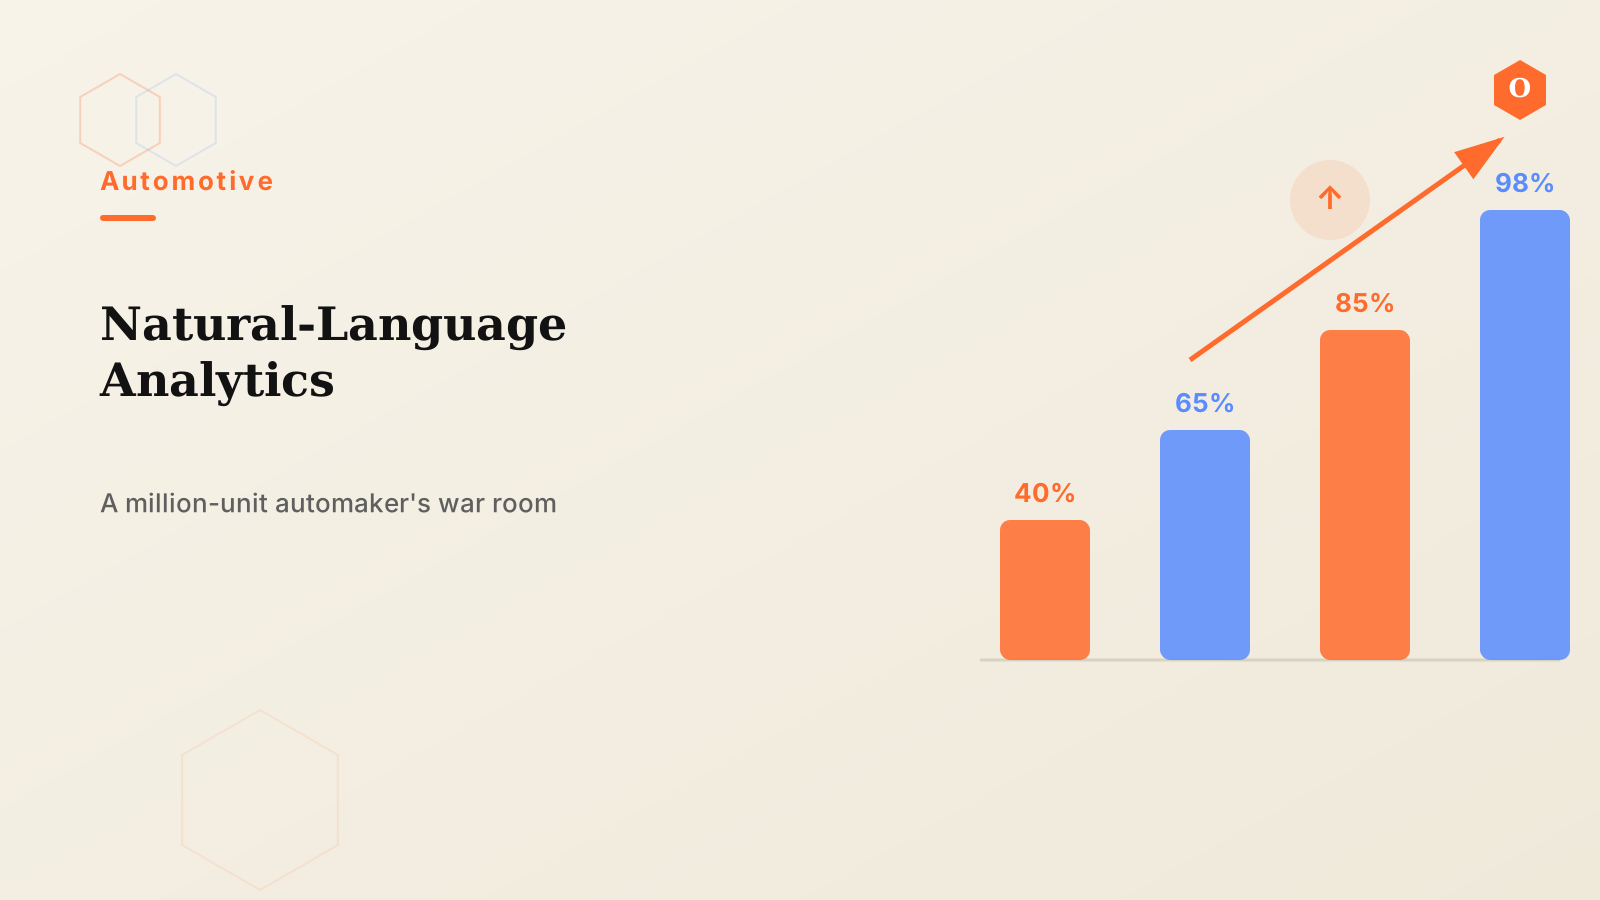
This was not a simple tool replacement, but the result of staged evolution: from an MVP validated on a single wide table, to a data semantic layer covering all 14 dashboards of the marketing operations center, and finally to "natural-language-driven interactive BI." The project achieved an MVP performance baseline of over 90% answer rate, over 85% accuracy, and an average response time under 70 seconds — turning data retrieval from a "specialist errand" into something "anyone can ask."
Background and Pain Points
Automotive management decisions rely heavily on cross-analysis across many dimensions and metrics: four dimensions (brand, vehicle series, region, time) combined with five key metrics (orders, wholesale, retail, inventory, insurance registrations) yield dozens or even hundreds of possible queries. In the past, the path to these figures was long — business users did not know SQL, and the database schemas were obscure. Every data request had to be translated by the data team.
Metric definitions were an even bigger headache. Retail volume, wholesale volume, and inventory coefficient were often calculated differently across finance, sales, and production departments. Process indicators such as insurance registrations, leads, test drives, and order follow-ups were scattered across different systems, and reconciling them manually was both slow and error-prone. Management genuinely wanted to "open the war room and see the full business picture," yet in reality they had built plenty of dashboards while still waiting two or three days for answers to a single question.
Like most group enterprises, this automaker also faced a "built but barely used" data platform: the platform held high-quality assets such as the master sales table (t_dm_mkt_sales_info_d), but lacked a bridge that let the business consume them directly. There were plenty of AI pilots, but most stayed at the demo level and never became tools the business could not live without.
What We Did
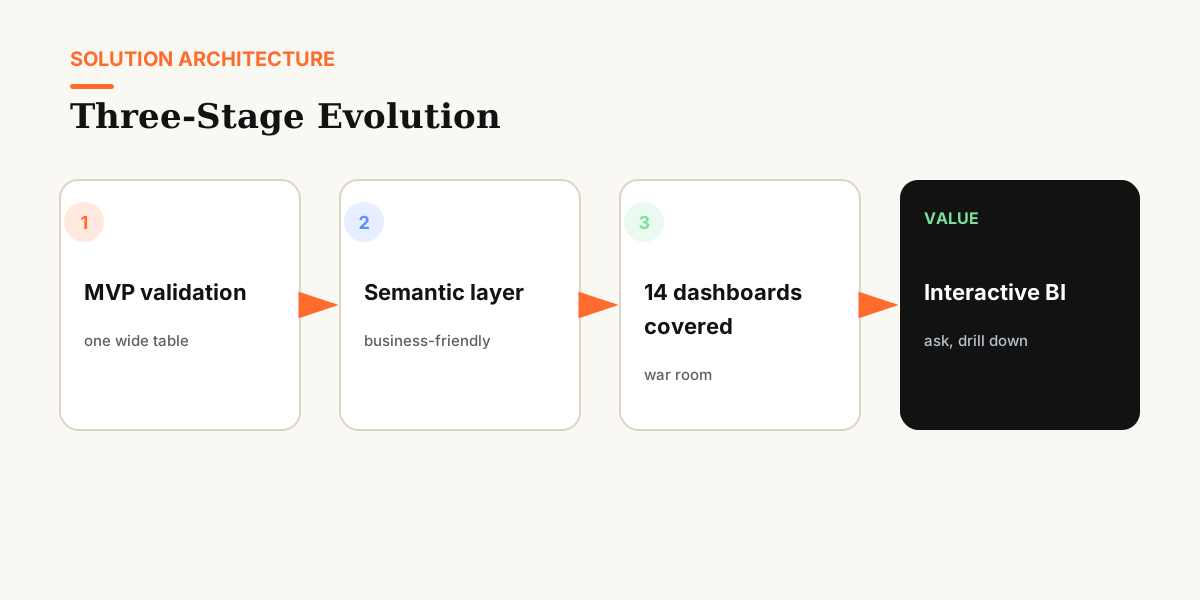
The project followed a "three-jump" evolution path, climbing from feasibility validation to supporting business decisions, one step at a time.
Jump 1: MVP validation. We focused on a single wide data table, strictly limiting the natural-language query scope to 4 dimensions and 5 metrics (production, orders, wholesale, retail, inventory), with hard scope guards. The goal at this stage was not feature breadth but proving whether natural language could be accurately translated into queries. This delivered the performance baseline of 90%+ answer rate, 85%+ accuracy, and under-70-second average response time, establishing a value benchmark for later expansion.
Jump 2: Capability enhancement — building an enterprise data semantic layer. We introduced the DBC (DBConnector) plugin so that AI could automatically inventory the business databases on the data platform and convert obscure table schemas into AI-comprehensible knowledge cards (DataCards) annotated with field meanings, typical values, and relationships — forming an enterprise data semantic layer without heavy ETL engineering. This step extended querying from "simple lookups" to "multi-table joins and complex combined queries," covering the real business scenarios behind the 14 dashboards of the marketing war room and transparent management, and supporting the group's "data-driven meetings."
Jump 3: Intelligent interaction, benchmarked against professional BI. We supported dynamic dimension filtering, chart drill-down/roll-up, and cross-system data fusion to deliver "natural-language-driven interactive BI," with a plan to scale group-wide in an "one agent per department" model. Data access continued to deepen: beyond the master sales table, process metrics such as insurance registrations, leads, test drives, and order follow-ups were added, enabling flexible combinations of core dimensions (brand, series, region, time) and indicators (orders, wholesale, retail, inventory, registrations).
Two mechanisms underpinned this evolution. First, a standardized "four-phase, 12-week" operating framework — diagnose, design, pilot, review — to scale from pilot to broad adoption and ensure applications were not just launched but genuinely used. Second, a "co-ownership" model between business and IT: a virtual team led by business departments with deep involvement from digital teams, with agent usage included in business-side performance reviews; every analytics dashboard was assigned a dedicated business tester, and weekly joint-testing feedback loops were established. We also built a business glossary to understand colloquial phrasing, designed intent-confirmation steps, and provided a transparent SQL execution details panel. End-to-end private deployment, strict RBAC permission control with field-level masking, and complete operation audit logs secured the data.
Results
- 14 dashboards covered: the marketing war room, transparent management, and other core scenarios are all included, supporting the group's daily data-driven meetings.
- Performance baseline met: 90%+ answer rate, 85%+ accuracy, and under-70-second average response time in the MVP stage.
- Wider metric coverage: beyond insurance registrations, process indicators such as leads, test drives, and order follow-ups now support a shift from "viewing outcomes" to "tracking the pipeline."
- Multiple scenarios: office, meeting, and mobile scenarios are all supported, so management can ask questions anytime, anywhere.
- Richer interaction: inline filters change dimensions dynamically and charts support click-to-drill-down, gradually approaching the interaction quality of professional BI tools.
One business leader described the change simply: "Before, we prepared data before a meeting; now we ask data during the meeting." Data has become part of the conversation, and decision evidence arrives on demand.
Lessons Learned: From Project to OntiCards
The most valuable takeaway from this project was turning "how to make AI understand enterprise data" into a repeatable methodology: do not expect a large model to read raw tables and produce answers directly — first build a semantic layer the business can understand. The role DBC played in this project — automatically inventorying data sources, converting database schemas into AI-comprehensible knowledge cards, building a data semantic layer without ETL — is precisely the predecessor of the OntiCards Data Card.
These lessons were distilled into OntiCards' automotive industry solution: using Data Cards as the semantic layer foundation so that natural-language analytics stays accurate, controllable, and traceable even in complex industry scenarios. The industry consensus is converging on the same path — on NL2SQL benchmarks like Spider 2.0 that approach real enterprise environments, asking models to write SQL directly from raw schemas yields very low success rates, while semantic-layer-governed approaches achieve dramatically higher accuracy. Gartner likewise positions the semantic layer as a critical component for the future of analytics and AI. For a deeper look at the architecture, see OntiCards' four-layer architecture and our semantic layer practice.